Think of analytics for Amazon sellers as the process of gathering, crunching, and making sense of your store's data to make smarter business decisions. It’s all about tracking the right numbers—sales, traffic, conversion rates, and ad performance—so you can stop making reactive tweaks and start building proactive, data-driven growth strategies.
Why Amazon Analytics Is Your Secret Growth Engine
Running an Amazon store without analytics is like flying a plane blindfolded. Sure, you might be moving, but you have no idea if you’re gaining altitude, heading in the right direction, or flying straight into a storm. Too many sellers get stuck in a reactive loop, slashing prices when sales drop or pumping more money into ads without knowing why. This isn’t just inefficient; it's a fast track to burnout in a marketplace that rewards precision.
The real goal is to move from guessing to knowing. Instead of just putting out fires, you can use data to spot trends, pounce on opportunities, and build a business that can weather any storm. When you use analytics for Amazon sellers the right way, your storefront transforms from a simple shop into an intelligent growth engine.
The Competitive Edge in a Crowded Market
Let's be honest: the Amazon marketplace is packed. But it’s also overflowing with opportunity. Third-party sellers are no longer the underdogs; they now account for more than 60% of all sales in Amazon's store. This proves that success isn’t just possible—it’s scalable for sellers who use data to get ahead. With so many brands fighting for the same eyeballs, understanding your performance data is what separates the brands that thrive from those that just get by. You can discover more insights on seller growth straight from Amazon's official reports.
Think of your data not as a jumble of numbers, but as the collective voice of your customers. Every session, click, and purchase is a piece of feedback telling you what’s working, what isn’t, and where to put your energy next.
When you learn to interpret this feedback, you can:
- Boost Profitability: Pinpoint exactly which products and ad campaigns are actually making you money and which are just draining your budget.
- Enhance Customer Experience: Tweak your listings based on how real shoppers search and what makes them click "Add to Cart."
- Build a Stronger Brand: Make strategic moves that set you up for long-term growth instead of chasing short-term fixes.
The Five Core Pillars of Amazon Analytics
Let’s be honest, staring at the raw data in Seller Central can feel like trying to drink from a firehose. There's so much information, it's almost impossible to know where to start. To make sense of it all, you need a framework.
The best way to do this is to organize everything into five core pillars. Each one represents a critical piece of your Amazon business.
Thinking in pillars turns a mess of abstract numbers into a clear, connected story. It helps you diagnose problems faster, spot opportunities you would have otherwise missed, and understand how a change in one area—like your ad spend—can ripple through your entire business. This is the first step in moving from just reacting to sales data to proactively building a profitable brand.
This is the strategic shift every serious seller needs to make, moving from blind selling to a proactive, analytics-driven approach.
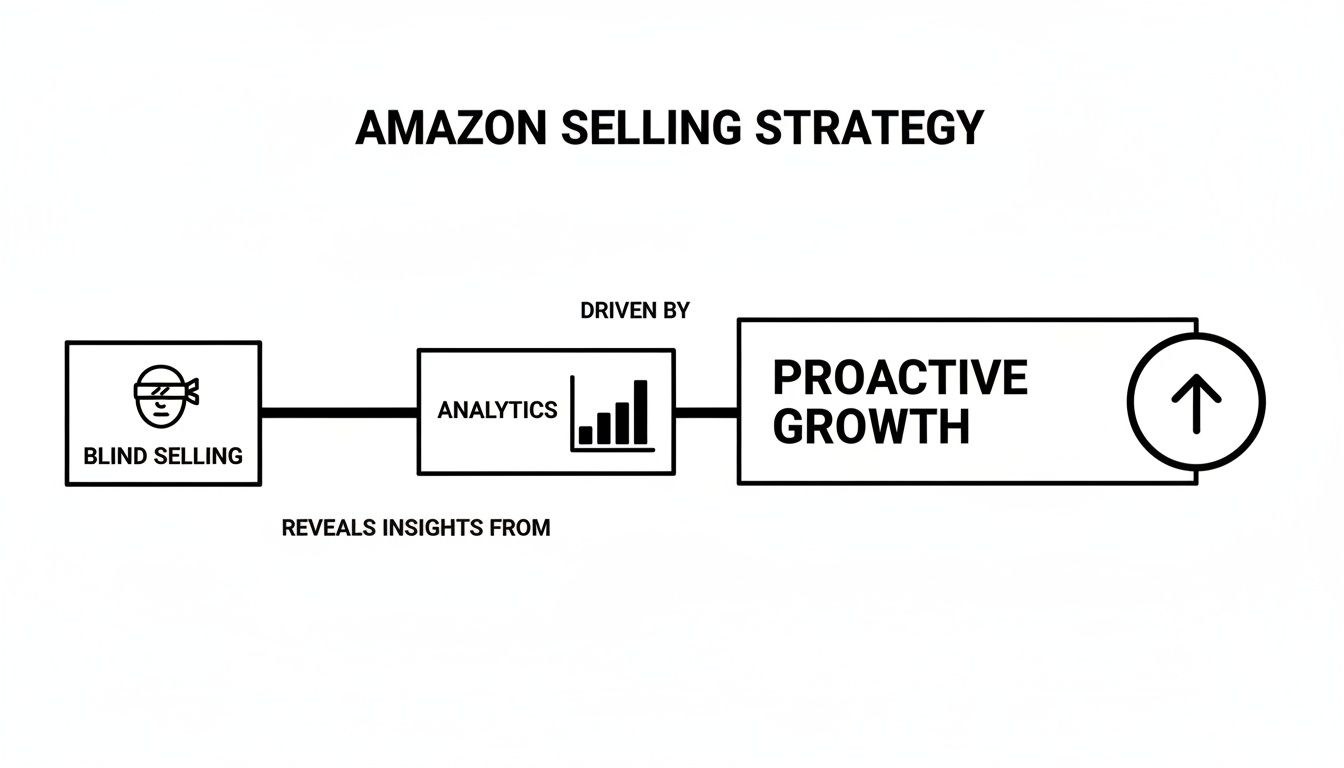
Analytics is the bridge that takes you from guesswork to intentional, profitable growth.
To give you a high-level view of how these pillars work together, here's a quick summary of the key metrics in each category.
Key Amazon Metrics by Analytics Pillar
This table breaks down the most important metrics within each of the five core analytics pillars. It defines what each KPI measures and, more importantly, explains its direct impact on your business's health and growth.
| Analytics Pillar | Key Metric (KPI) | What It Measures | Why It Matters |
|---|---|---|---|
| Sales & Profitability | Net Profit Margin | The percentage of revenue left after all expenses (COGS, fees, ads) are deducted. | It's the ultimate measure of business health. High revenue means nothing if you aren't actually keeping any of it. |
| Traffic & Discovery | Sessions | The total number of unique visits to your product detail pages within a 24-hour period. | This tells you if your SEO and marketing efforts are successfully driving potential buyers to your listings. No traffic, no sales. |
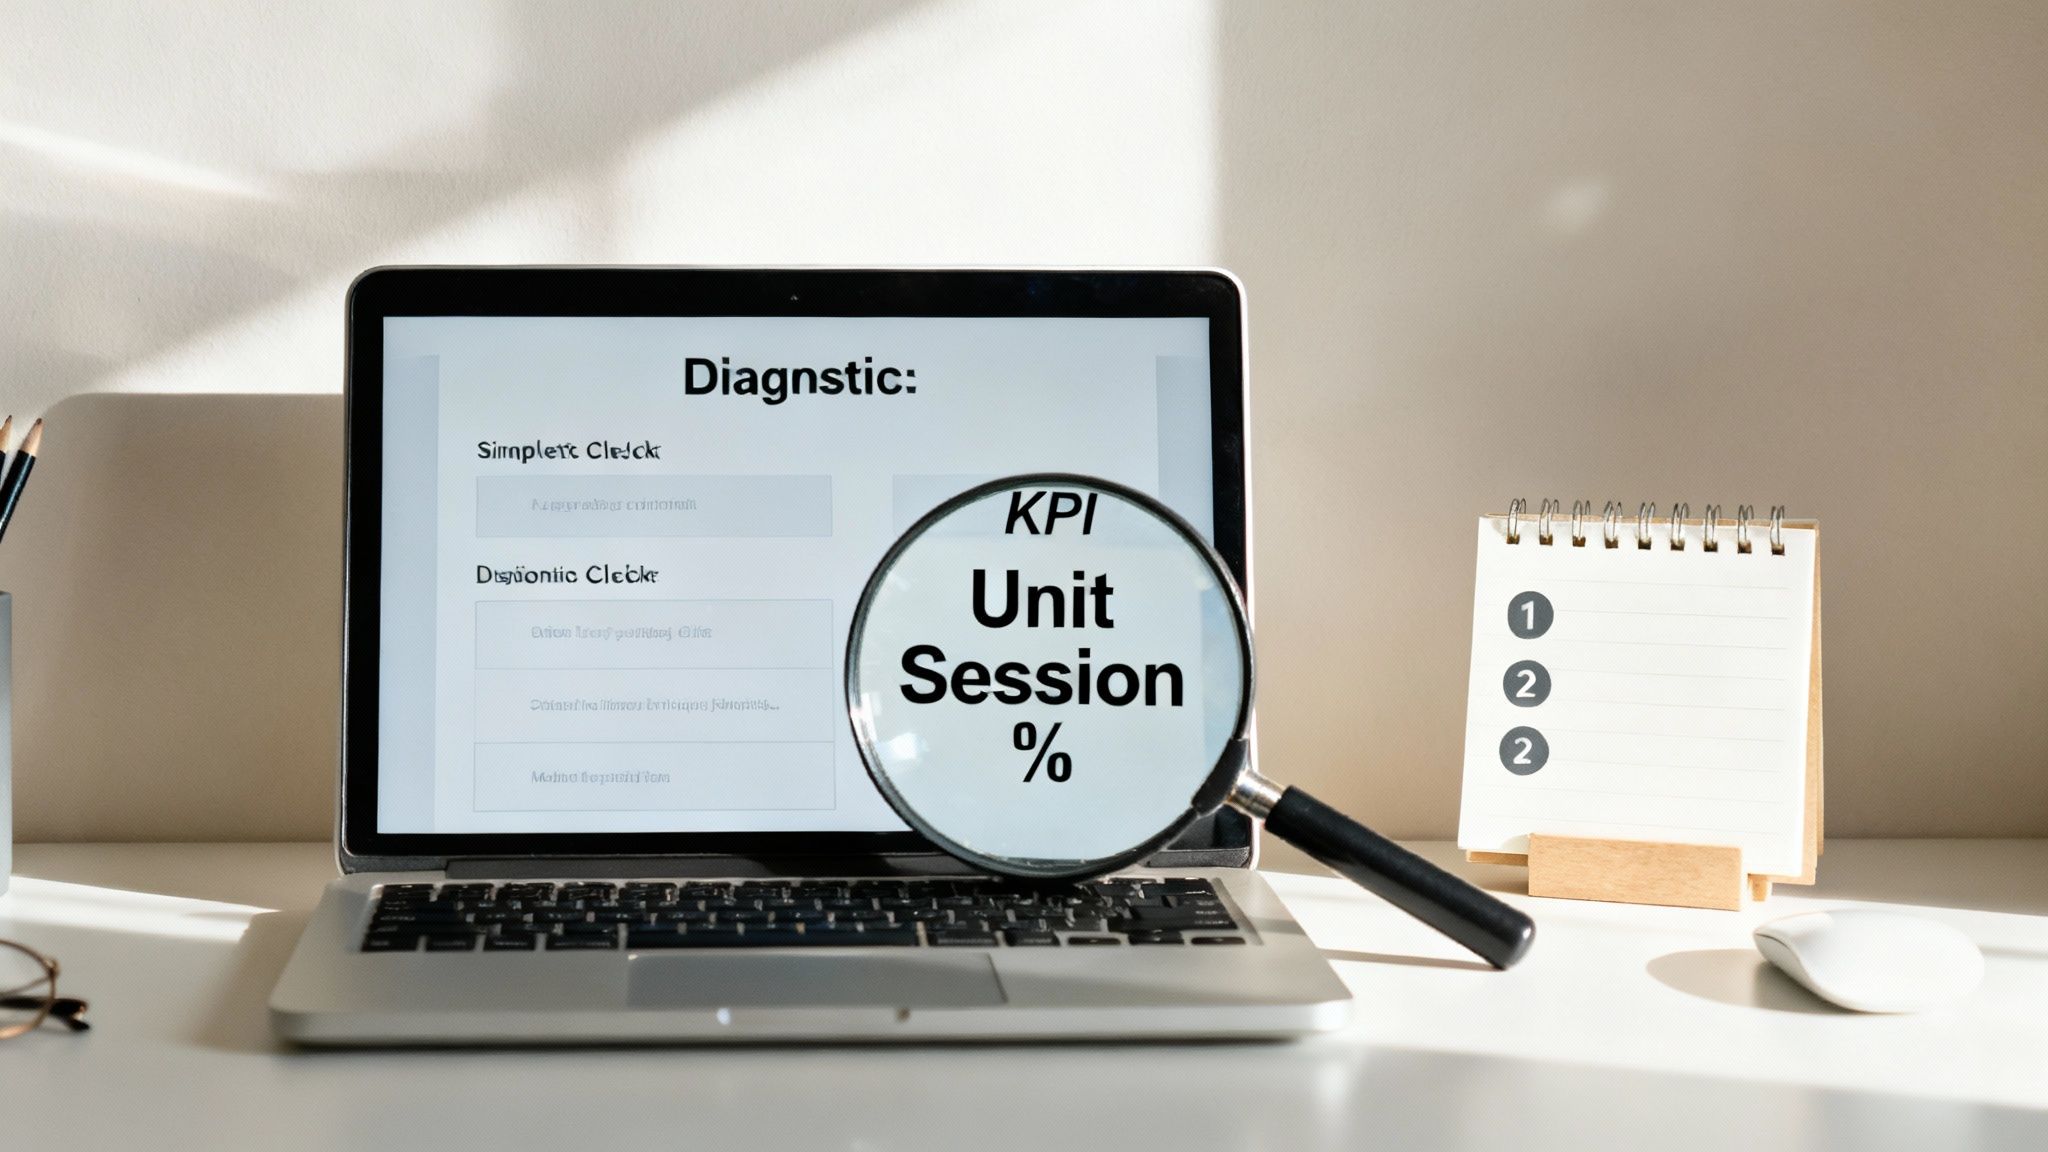
| Customer Conversion | Unit Session Percentage | The percentage of sessions that result in at least one unit sold. This is your conversion rate. | This shows how effectively your listing turns visitors into buyers. A high rate signals to Amazon your product is a winner. |
| Advertising Performance | TACoS | Your total ad spend as a percentage of your total revenue (organic + ad-driven sales). | This measures ad efficiency in the context of your overall business, helping you see if ads are truly driving incremental growth. |
| Inventory & Operations | IPI Score | A single metric (0-1000) that measures your FBA inventory health and efficiency over time. | A low score leads to storage limits and fees, directly hurting your profitability and ability to stay in stock. |
By tracking these KPIs together, you get a complete picture of your business performance, making it much easier to pinpoint exactly where you need to focus your efforts.
Pillar 1: Sales and Profitability
This is the bottom line. The ultimate measure of your business’s health. It answers the most fundamental question: “Am I actually making any money?”
This pillar goes way beyond just looking at your total revenue. It forces you to dig into the profitability of every single sale after accounting for Amazon's mountain of fees, your ad spend, and the cost of your products.
Key questions this pillar helps you answer:
- Which of my products are my real moneymakers?
- What’s my true profit margin after every single expense is paid?
- Are my sales trends actually growing, or are they flatlining?
Getting these numbers right is non-negotiable. A business with high revenue but zero profit isn’t a business—it’s just an expensive hobby.
Pillar 2: Traffic and Discovery
If sales are the destination, traffic is the highway that gets customers to your door. This pillar is all about how many potential buyers are actually finding your product listings. It’s a game of visibility.
You could have the most incredible product in the world, but if nobody ever sees it, it’s not going to sell. It's that simple.
This pillar is measured by metrics like Sessions (the number of visits to your pages) and Page Views. A sudden drop in traffic is a huge red flag—it’s an early warning that something is wrong with your keyword rankings or ad campaigns. Consistently low traffic means you need to seriously rethink how shoppers discover your products. To get a head start, you need to learn how to optimize your Amazon product listings to pull in more qualified buyers.
Pillar 3: Customer Conversion
Okay, so you’ve got traffic. Now what? The next challenge is convincing those visitors to actually click the "buy" button. That's what the conversion pillar is all about.
It measures how well your product detail page turns a casual browser into a paying customer. The single most important metric here is your Unit Session Percentage—your conversion rate.
A high conversion rate is the ultimate signal to Amazon's A10 algorithm that your product is a winner. It tells Amazon that when shoppers land on your page, they find exactly what they're looking for. This leads to better organic rankings and a much healthier return on your ad spend.
This pillar helps you evaluate the quality of your listing. Are your images compelling? Is your copy persuasive? Do your reviews build trust? A low conversion rate means you’re spending money to bring visitors to a leaky bucket. It's time to plug the holes.
Pillar 4: Advertising Performance
For most sellers today, running Amazon PPC ads is a non-negotiable part of any growth strategy. This pillar is dedicated to measuring how effective—and efficient—your ad spend really is. It’s not just about getting clicks; it’s about getting profitable sales from those clicks.
Key metrics you’ll live and breathe here are:
- Advertising Cost of Sales (ACoS): The percentage of attributed sales spent on advertising.
- Total Advertising Cost of Sales (TACoS): Your ad spend as a percentage of your total sales (both organic and ad-driven).
- Click-Through Rate (CTR): The percentage of people who click your ad after seeing it.
Managing your advertising analytics properly ensures your ad budget is an investment that generates a real return, not just an expense that eats away at your profits.
Pillar 5: Inventory and Operations
This final pillar is the one that keeps the entire engine running smoothly. You can have amazing sales, traffic, and conversions, but if you run out of stock, everything grinds to a halt. Zero sales.
This pillar focuses on your operational health. Amazon keeps a close eye on this with its Inventory Performance Index (IPI) score. A healthy IPI is crucial for avoiding storage limits and painful penalty fees.
This pillar answers critical questions like, "Do I have enough stock to meet demand, but not so much that I'm getting killed on storage fees?" Ignoring your operational analytics can lead to stockouts, lost sales, and penalties that directly crush your profitability.
Finding Actionable Data in Seller Central
Knowing that powerful data exists is one thing. Actually finding the gold nuggets inside Amazon's sprawling interface is a whole other challenge. Seller Central can feel like a labyrinth, but a few key reports contain pretty much everything you need to make smarter, faster decisions.
Think of it less as a maze and more as a treasure map. Specific reports lead directly to profitable insights, and you just need to know which ones to open.
Your main destinations for analytics for an Amazon seller will be the Business Reports dashboard and the Advertising Console. Each one gives you a different window into your business performance. The real trick is knowing which report to pull up to answer a specific question, rather than just clicking around hoping to stumble on something useful.
Instead of getting lost, focus on mastering the essentials. A handful of reports will give you 80% of the value for just 20% of the effort.
Uncovering Insights in Business Reports
The Business Reports dashboard is your home base for organic performance and overall sales health. It cuts through the noise of ad-specific metrics to give you a clean look at how your listings are performing on their own merit.
Here are the most valuable reports to get a handle on:
- Detail Page Sales and Traffic by ASIN: This is arguably the single most important report in Seller Central. It shows you the core metrics for traffic (Sessions) and conversion (Unit Session Percentage) for every single one of your products. If sales suddenly drop, this is the first place you should look to figure out if it’s a traffic problem (fewer visitors) or a conversion problem (visitors aren't buying).
- Sales and Traffic Report: This report gives you a high-level view of your entire account's performance over time. Use it to spot weekly or monthly trends in your overall traffic and conversion rates. It helps you understand the big picture before you start digging into individual product performance.
These reports help you answer critical questions like, "Are my new product images actually improving my conversion rate?" or "Did my keyword ranking drop last week, causing a dip in sessions?"
Pinpointing Ad Performance in the Advertising Console
While Business Reports show your organic health, the Advertising Console is where you measure the direct return on your ad spend. Amazon’s advertising ecosystem is a massive revenue driver, pulling in over $40 billion, and Sponsored Products make up more than 75% of that total.
With average conversion rates for these ads hitting a solid 9–10%, optimizing your campaigns is non-negotiable.
Key Insight: Don't just look at Advertising Cost of Sales (ACoS). A low ACoS on a campaign that drives zero incremental organic sales is just an illusion of success. True advertising analytics measures how your ads lift your total business, not just your ad-attributed sales.
To find data you can actually use, focus on two key reports:
- Search Term Report: This is your direct line into the customer's mind. It shows you the exact search terms shoppers used right before they clicked your ad. Mine this report weekly for new, high-converting keywords to add to your campaigns and irrelevant terms to add as negative keywords to stop wasting money.
- Campaign Performance Report: This report gives you a full breakdown of every campaign's performance, including impressions, clicks, spend, and sales. Use this to see which campaigns are profitable and which ones are just draining your budget, allowing you to move your money where it will work hardest.
Centralizing Your Data with Third-Party Tools
Jumping between Seller Central and the Advertising Console to piece together the full picture of your business can be incredibly time-consuming. This is where third-party analytics tools become a game-changer.
These platforms connect directly to your account using the Amazon Marketplace API to pull all your data into one unified dashboard.
Instead of manually exporting and merging spreadsheets, these tools automatically calculate your true profitability, track keyword rankings, and monitor inventory levels all in one place. You can learn more by checking out our deep dive into how to use Amazon sales data to its full potential. This centralized approach turns scattered data points into a single, powerful command center, saving you hours of work and revealing insights you might have otherwise missed.
How to Turn Analytics Into Growth Strategies
Data is just a bunch of numbers until you do something with it. Knowing your metrics is step one, but real growth happens when you use those numbers to fix problems and make smarter decisions. This is where we stop talking theory and start building a practical playbook for using analytics for Amazon sellers to solve the most common headaches you'll face.
Instead of guessing what went wrong, you can follow a clear diagnostic process. It’s all about pinpointing the right metric, finding it in the right report, understanding what it’s telling you, and then executing a specific, data-backed fix. Let's walk through two of the most frequent fires every seller has to put out.
Scenario 1: My Sales Suddenly Dropped
It’s a feeling that makes your stomach drop. You check your sales dashboard, and the numbers have fallen off a cliff. Panic mode kicks in, and the first impulse is usually to slash prices or blindly throw more money at ads.
Stop. Breathe. This is a moment for a calm, data-driven diagnosis.
The first question isn't "Why did sales drop?" but rather, "Is this a traffic problem or a conversion problem?" They're two completely different issues with completely different solutions.
Step 1: Identify the Key Metrics and Report
- Primary Metric to Check: Unit Session Percentage (your conversion rate).
- Secondary Metric to Check: Sessions (your traffic).
- Report to Use: Head over to Seller Central > Reports > Business Reports > Detail Page Sales and Traffic by ASIN.
This one report holds the key. It breaks down traffic and conversion for every single product you sell.
Step 2: Interpret the Data
Look at the data for the product in question over the last 7-14 days. You’re going to see one of two patterns emerge:
- Sessions Dropped, Conversion Rate is Stable: You’ve got a traffic problem. Fewer people are finding your listing, but the ones who do are still buying at the same rate. This could be anything from losing your keyword rank to a competitor outbidding you on ads.
- Sessions are Stable, Conversion Rate Dropped: This is a conversion problem. You’re getting the same number of eyeballs on your page, but something is stopping them from clicking "Add to Cart." Maybe it's a new 1-star review, a competitor undercutting your price, or your main image suddenly looking dated.
A conversion problem is often more urgent. You're paying to send traffic to a page that isn't working, effectively burning cash with every click. A traffic problem is about visibility; a conversion problem is about the quality and persuasiveness of your listing.
Step 3: Implement a Targeted Solution
Now that you know the real problem, you can take specific, informed action instead of just guessing.
- If it's a traffic problem:
- Check your organic keyword rankings for your top 5-10 search terms. Did you slip?
- Dive into your PPC campaigns. Has your top-of-search impression share taken a nosedive?
- Scope out the competition. Did someone just launch an aggressive ad campaign?
- If it's a conversion problem:
- Read your most recent product reviews. Is there a new negative comment scaring people off?
- Check your competitors' pricing. Did your main rival just launch a big sale?
- Take a hard look at your listing. Are your images, title, and bullet points still the best in class? It might be time for a refresh.
Scenario 2: My Ad Spend Is High but Sales Are Flat
This is another classic headache. You keep pouring money into Amazon PPC, but your total sales just won't budge. This usually means your ads are either stealing sales you would have gotten organically anyway or they’re just plain inefficient. The goal here is to lower your Advertising Cost of Sales (ACoS) without tanking your visibility.
If you need a refresher on the basics, our guide on what Amazon PPC is and how it works is a great place to start.
Step 1: Identify the Key Metrics and Report
- Primary Metric to Check: Advertising Cost of Sales (ACoS) at the campaign and search term level.
- Secondary Metric to Check: Click-Through Rate (CTR) and Conversion Rate (CVR) for your ads.
- Report to Use: In the Advertising Console, download a Search Term Report for the last 30 days.
This report is the holy grail for PPC optimization. It shows you the exact customer search terms that triggered your ads and how each one performed.
Step 2: Interpret the Data
Pop that Search Term Report open in a spreadsheet and start hunting for wasted ad spend. You’re looking for two specific culprits:
- High-Spend, Zero-Sale Search Terms: These are keywords that are getting clicks and costing you money but haven’t produced a single sale. They're a pure drain on your budget.
- Irrelevant Search Terms: Look for terms that have nothing to do with your product. If you sell "leather dog collars," you definitely don't want to be paying for clicks from someone searching for a "retractable dog leash."
Step 3: Implement a Targeted Solution
Your mission is to surgically remove the waste so you can redirect your budget to what’s actually working.
- Add Negative Keywords: Take that list of high-spend, zero-sale terms and irrelevant keywords. Add them as negative exact match keywords to your campaigns. This instantly stops your ads from showing up for those unprofitable searches.
- Optimize Bids: For search terms that are converting but have a sky-high ACoS, try lowering your bid slightly to improve profitability.
- Double Down on Winners: Find the high-converting, low-ACoS "golden" keywords in your report. These are your money-makers. Consider moving them into their own dedicated campaigns where you have more precise control over their budget and bids.
By following this diagnostic process, you’re turning raw data into a clear action plan. You stop making emotional decisions and start treating your Amazon store like a data-driven business, making precise adjustments that directly boost your bottom line.
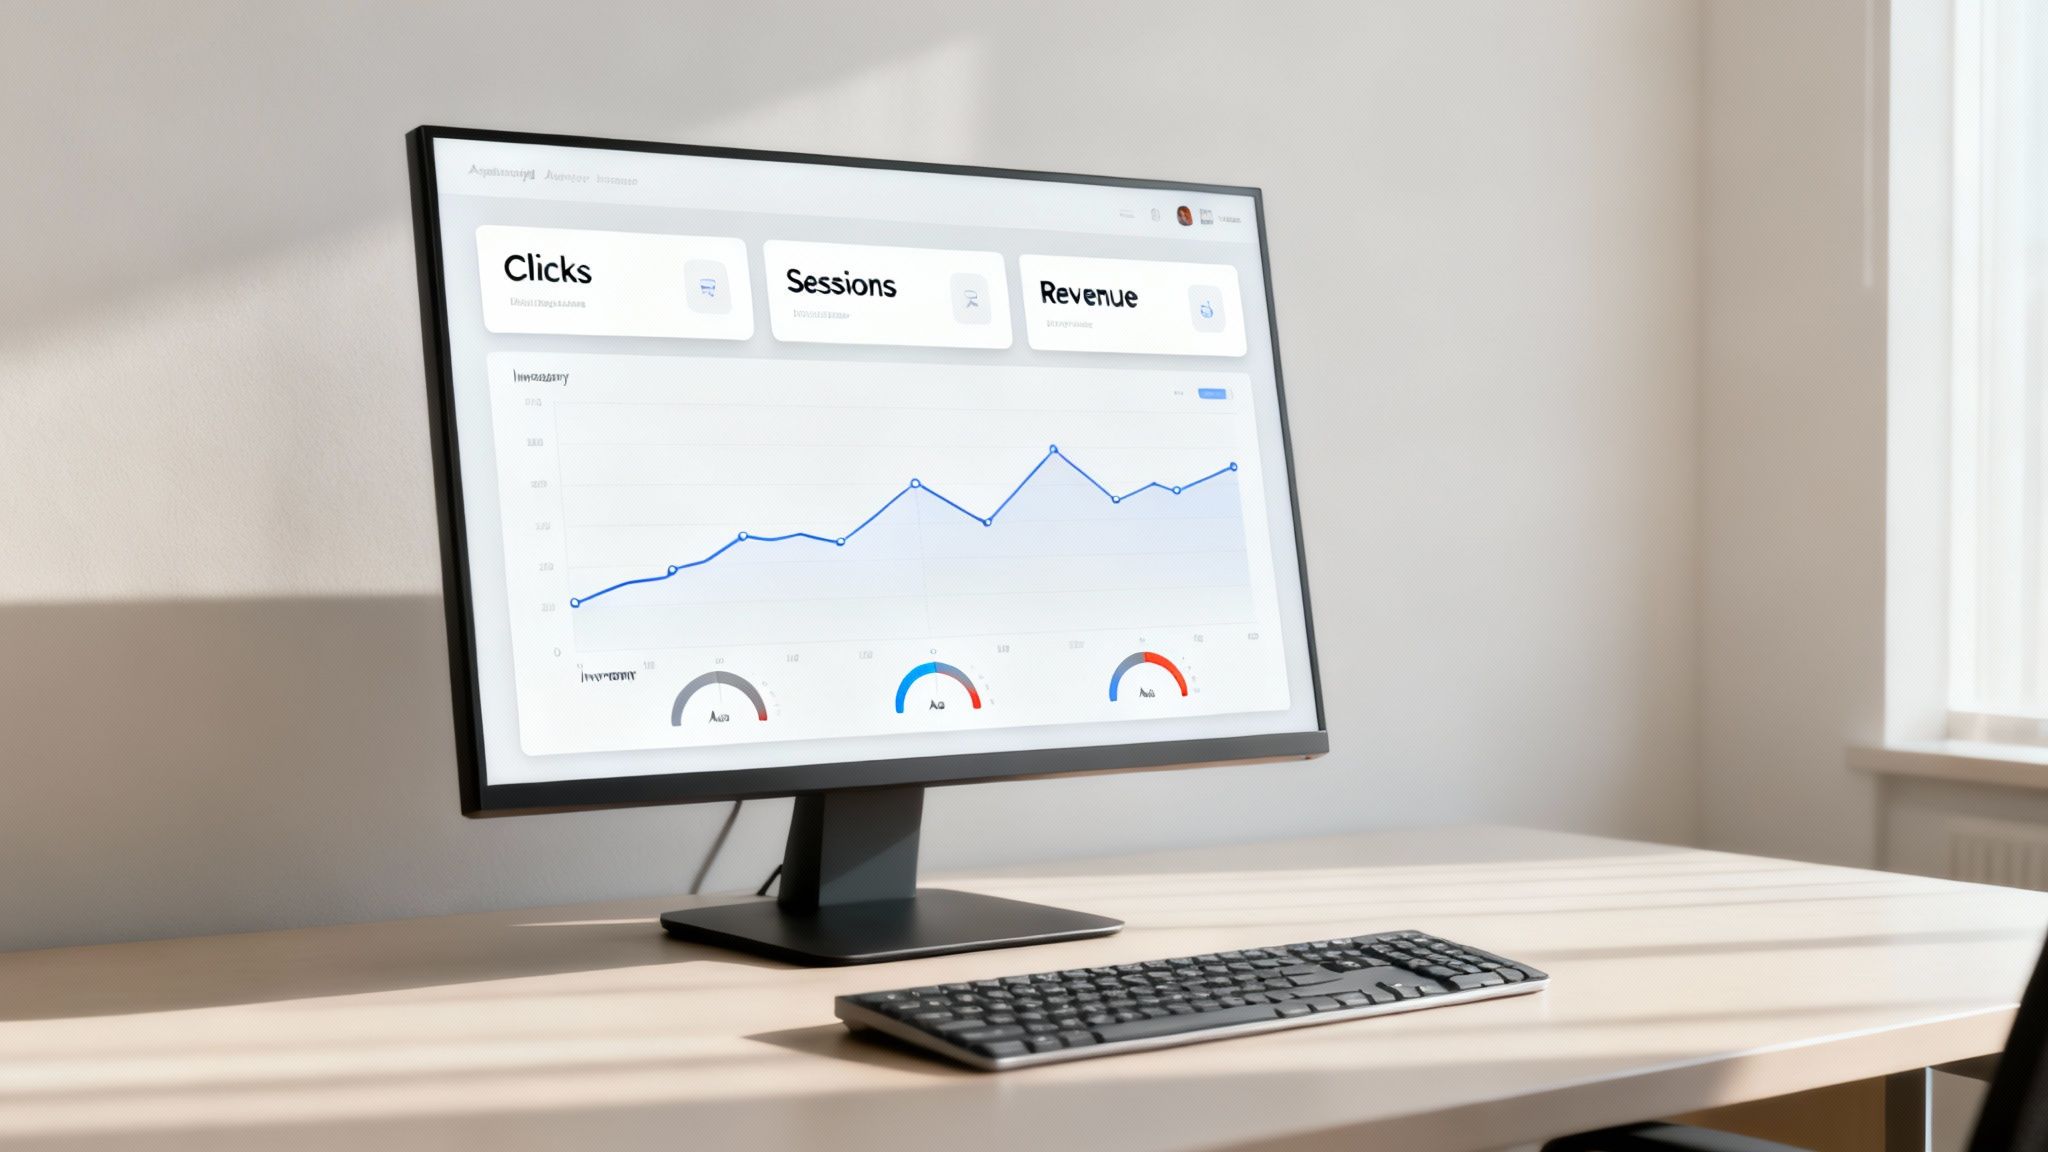
Building a Dashboard to Monitor Your Business Health
Checking reports randomly is like trying to drive a car by only looking in the rearview mirror. It tells you where you’ve been, but not where you’re going. To really steer your business, you need a mission control center—a simple but powerful analytics dashboard that shows you everything at a glance.
This is how you get out of reactive fire-fighting mode and start systematically monitoring your business's health. A good dashboard helps you spot trends before they become problems, see the real impact of your strategic changes, and keep a constant pulse on the metrics that actually matter.
Leading vs. Lagging Indicators
The secret to a dashboard that works is knowing the difference between two types of metrics: leading and lagging indicators. Getting this right is the foundation of any https://npoint.digital/data-driven-marketing-strategies/ that aims for proactive growth instead of just reacting to past performance.
- Lagging Indicators: These numbers report on what’s already happened. Think Total Revenue or Net Profit. They’re like the final score of a game—essential for knowing if you won, but they can't change the outcome.
- Leading Indicators: These metrics give you clues about what’s likely to happen next. Things like Sessions, Click-Through Rate (CTR), and Unit Session Percentage are leading indicators. They’re the in-game stats that tell you if your current plays are on track to win.
A great dashboard balances both. You use lagging indicators to confirm your long-term strategy is sound and leading indicators to make the daily and weekly tweaks that keep you headed in the right direction.
Building Your Amazon KPI Dashboard
You don’t need fancy, expensive software to get started. A simple spreadsheet can be incredibly effective. The whole point is to track the most important KPIs from each of the five pillars—Sales, Traffic, Conversion, Advertising, and Inventory—on a daily, weekly, and monthly basis.
Every dashboard should be customized to your business, but here’s a solid template to get you going:
| Pillar | Daily Metric | Weekly Metric | Monthly Metric |
|---|---|---|---|
| Sales & Profitability | Gross Sales | Net Profit | Profit Margin Trend |
| Traffic & Discovery | Sessions | Sessions by ASIN | Organic vs. Ad Traffic |
| Customer Conversion | Units Ordered | Unit Session % | Conversion Rate Trend |
| Advertising | Ad Spend & ACoS | Search Term Wins/Losses | TACoS |
| Inventory | Units Sold | Sell-Through Rate | IPI Score |
This structure gives you a layered view. Daily checks help you catch sudden fires, weekly reviews guide your tactical adjustments, and monthly analysis shapes your big-picture strategy. To really take it to the next level, look for tools that offer real-time profit tracking.
Why a Dashboard Is a Competitive Necessity
In today’s marketplace, having a systematic approach to analytics isn’t just a nice-to-have; it’s how you survive. While the flood of new sellers has slowed down, the market has become dominated by more professional operators. The number of active sellers actually dropped from 2.4 million in 2021 to 1.65 million, but Amazon's third-party sales kept climbing.
What does that mean? The opportunity per seller has gone up. In fact, traffic per active seller has jumped 31% since 2021. The number of sellers hitting $1 million or more in annual sales has more than doubled, proving that sophisticated, data-driven sellers are carving out a bigger piece of the pie for themselves. A dashboard is your tool to compete at this higher level.
Your Path to Becoming a Data-Driven Seller
Getting buried in data is easy. Finding real clarity in the numbers? That’s where the real growth begins. Mastering analytics for Amazon sellers isn’t about learning to be a data scientist overnight. It’s about making data a core part of how you run your business.
By focusing on the five pillars—Sales, Traffic, Conversion, Advertising, and Inventory—you start turning raw numbers into a strategic roadmap. This framework lets you stop reacting to what the market throws at you and start shaping your own success. Every insight is a chance to tweak your strategy, turning small, consistent actions into massive long-term wins.
This is about taking control of your store's destiny.
The ultimate goal is to move beyond just selling products and start building an intelligent, data-driven business. This shift turns your Amazon store from a passive asset into an active growth engine that you can tune and direct with confidence.
But let's be honest—managing all this complexity while trying to scale is a huge undertaking. For sellers who are serious about accelerating their growth, bringing in an expert is a smart move.
An agency partner acts as an extension of your team, handling the complicated data workflows, putting advanced strategies into action, and helping you scale profitably. It’s an investment in expertise that frees you up to focus on your brand while your data does the heavy lifting for you. To learn more, check out our guide on how to grow sales on Amazon.
Frequently Asked Questions About Amazon Analytics
Diving into Amazon analytics can feel like drinking from a firehose. You’ve got data coming from all directions, and it’s easy to feel overwhelmed. Here are a few common questions sellers ask, with straightforward answers to help you stay focused on what really matters.
What Is the Single Most Important Metric?
If I had to pick just one, it would be the Unit Session Percentage. You might know it by another name: your conversion rate. It’s the clearest indicator of how well your listing convinces shoppers to actually buy your product.
Think about it. A high conversion rate is the ultimate signal to Amazon that your product is a winner. It tells the A10 algorithm that your price, images, copy, and reviews are all working together perfectly. This creates a snowball effect—better conversion leads to higher sales velocity, which improves your organic rank and makes every dollar you spend on ads work harder.
How Often Should I Check My Analytics?
Checking your data too often is just as bad as not checking it at all. You'll drive yourself crazy reacting to every little dip and spike. A tiered approach is the best way to stay on top of things without getting lost in the noise.
- Daily (5-Minute Check): Glance at your leading indicators like Sessions, Ad Spend, and day-over-day Sales. The goal here isn't deep analysis; it's to catch any sudden fires before they get out of control.
- Weekly (30-Minute Analysis): This is where you dig a little deeper. Look at your Unit Session Percentage, Advertising Cost of Sales (ACoS), and overall profit margins. This weekly pulse check helps you make smart tactical adjustments for the week ahead.
- Monthly (Full Business Review): Time to zoom out and look at the big picture. Analyze long-term trends, check your Inventory Performance Index (IPI) score, and see what customers are saying in their reviews. This is when you make strategic decisions that will shape the next quarter.
When Should I Use a Third-Party Tool?
You should start thinking about a third-party analytics tool the second you find yourself spending more time pulling data than actually analyzing it. If your routine involves patching together reports from Seller Central and the Ad Console in a messy spreadsheet, it’s time for an upgrade.
These tools are built to do the heavy lifting for you. They automate the mind-numbing task of data collection, turn complex numbers into easy-to-read dashboards, and, most importantly, calculate your true profitability after all of Amazon’s fees. For anyone managing more than a handful of products or a serious ad budget, a good tool will save you dozens of hours and help you spot growth opportunities you’d never find on your own.
Ready to stop guessing and start growing with a data-driven strategy? The experts at Next Point Digital can transform your complex analytics into a clear roadmap for profitable growth. Learn more about our Amazon growth services today!