If you're selling on Amazon, you're sitting on a goldmine of information. But what exactly is Amazon sales data? It's not just about how much money you made last week. Think of it as the complete story of your business—a detailed collection of metrics and reports that reveal your performance, how customers behave, and where product trends are headed.
Getting a handle on this data is the difference between guessing your way forward and making strategic, profitable decisions. It’s the language your business speaks, telling you exactly why you're winning or losing on any given day.
What Is Amazon Sales Data
Imagine your Amazon business is a high-performance race car. Your Amazon sales data is the digital dashboard right in front of you. Every single metric is a gauge: sales velocity is your speed, inventory levels are your fuel, and profit margins are your engine's health. It’s all the raw information that, once you piece it together, tells a clear story about how you're performing.
This data goes way beyond simple daily sales figures. It covers a huge range of information that helps sellers navigate the crowded and competitive world of one of the planet's biggest digital marketplaces. These insights are what turn abstract numbers into real-world business intelligence you can actually use.
The Scope of Amazon's Marketplace Data
The sheer size of Amazon's operation means it generates an almost unimaginable amount of data. The platform's Gross Merchandise Value (GMV)—the total value of everything sold—rocketed to nearly $700 billion globally in recent years.
While Amazon's own direct sales made up around $220 billion of that, third-party sellers contributed a massive $117.72 billion through seller services. That number alone shows just how big of a role independent sellers like you play in this ecosystem.
This infographic gives you a quick visual breakdown of a few of the core metrics and what they look like in action.
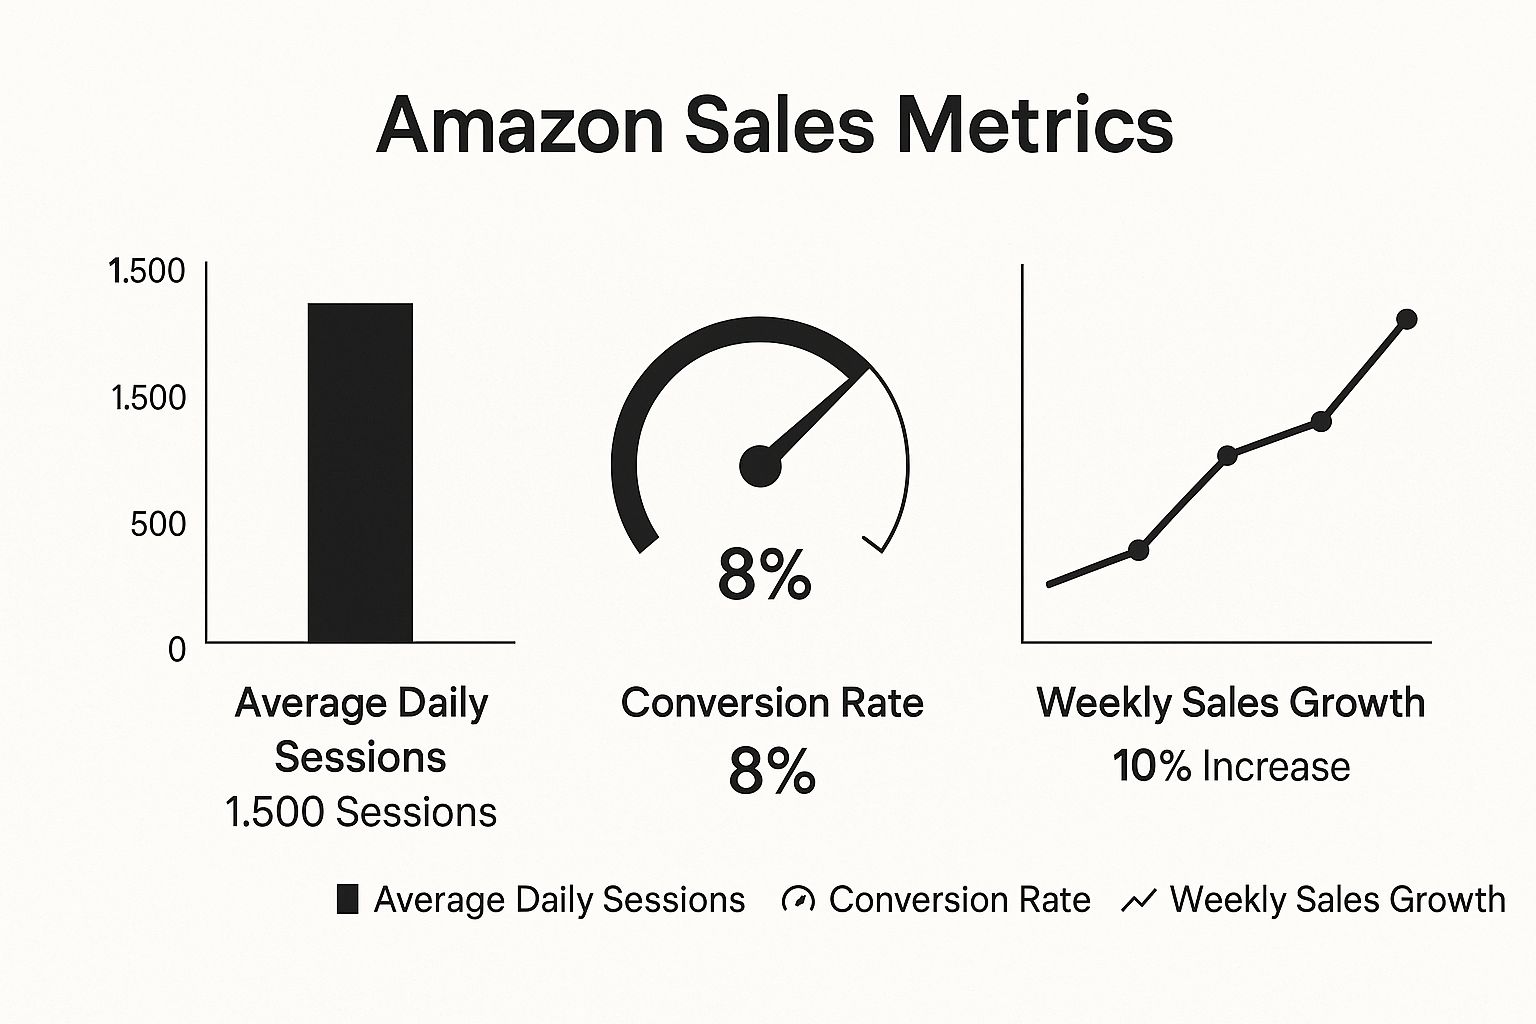
As you can see, it’s not just about one number. A seller can track daily traffic (sessions), see how well their listing is convincing people to buy (conversion rate), and keep an eye on the bigger picture (sales growth).
Why This Data Is Your Greatest Asset
If you're not interpreting your sales data correctly, you're basically driving blind. You might see that sales are down, but you won't have a clue why. Is it because you’re getting less traffic? Is your conversion rate tanking? Or did a new competitor just slash their prices?
By regularly analyzing your sales data, you can diagnose problems before they become critical, identify hidden growth opportunities, and build a more resilient and profitable business on the platform.
Good data analysis lets you answer the tough questions that actually shape your strategy:
- Customer Behavior: Which products are people looking at but not adding to their cart?
- Marketing Effectiveness: Are my ad campaigns actually driving sales, or am I just paying for clicks?
- Inventory Management: When do I need to reorder to avoid stocking out right before a busy season?
- Product Performance: Is my brand-new product catching on, or does the listing need a serious overhaul?
Decoding Your Most Important Sales Metrics

To really get a grip on your Amazon performance, you have to do more than just glance at the numbers. You need to learn how to make them tell a story about your business. Every metric in your dashboard is a clue, a piece of a larger puzzle that reveals what’s working and what’s falling flat.
Think about it: high traffic is great, but it’s only half the story. If you're pulling in thousands of views but only making a handful of sales, your problem isn't visibility—it's your product listing. This is where digging into specific metrics stops being optional and becomes essential.
Before we dive deep, here's a quick look at the core metrics every Amazon seller should be tracking. Think of this table as your cheat sheet for translating numbers into actionable insights.
Key Amazon Seller Metrics and Their Meaning
| Metric | What It Measures | What a Low/High Value Might Indicate |
|---|---|---|
| Total Sales (GMV) | Your top-line revenue from all product sales in a given period. | High: Strong demand or successful marketing. Low: Could signal issues with visibility, pricing, or the listing itself. |
| Units Ordered | The total number of individual items sold. | High: Good sales volume. Comparing it to Total Sales reveals if customers are buying cheaper or more expensive items. |
| Sessions | The number of unique visits to your product pages in a 24-hour period. | High: Effective advertising or strong organic rank. Low: Suggests your ads aren't working or your search visibility has dropped. |
| Unit Session % | Your conversion rate; the percentage of sessions that result in a sale. | High: Your product page is compelling and converting well. Low: Signals a problem with your listing (images, copy, price). |
| Buy Box % | How often your offer is the default choice when a customer clicks "Add to Cart." | High: You are the primary seller. Low: Competitors or resellers are stealing sales, often due to better pricing or fulfillment. |
Understanding these metrics individually is good, but seeing how they connect is what gives you the power to make smart decisions.
Foundational Sales and Traffic Metrics
Let's start with the basics. These are the vital signs of your Amazon store. You should be checking them daily to spot any sudden shifts in performance before they become major problems.
- Total Sales: This is your gross revenue, often called Gross Merchandise Value (GMV). It’s the total dollar amount you've generated from sales over a set period. It's the most straightforward indicator of your business's scale.
- Units Ordered: This is a simple count of how many individual items you’ve sold. When you compare this to Total Sales, you can start to see trends in your average order value. Are people buying more items, or are they buying more expensive items?
- Sessions: Think of Sessions as the digital equivalent of foot traffic. It’s the total number of visits to your product pages within a 24-hour window. A sudden drop here is your first red flag that something is hurting your visibility, like a failing ad campaign or a dip in your search ranking.
Conversion and Performance Metrics
Getting people to your page is one thing; getting them to buy is another entirely. Conversion metrics show you just how good your product listings are at convincing shoppers to click that "Add to Cart" button.
This is where Unit Session Percentage comes in. It’s just Amazon’s fancy term for your conversion rate, calculated by dividing units ordered by total sessions. This single percentage is one of the most powerful diagnostic tools you have.
For example, if you have tons of Sessions but a painfully low Unit Session Percentage, it’s a massive red flag. Something on your product page is scaring customers away. It could be anything from:
- Blurry or unappealing product images
- Confusing or weak product copy
- A flood of negative reviews
- Pricing that’s way out of line with competitors
This insight is gold. It tells you to stop throwing money at ads and start fixing the real problem: the listing itself. By improving your photos or rewriting your bullet points, you can directly lift this percentage and, in turn, your sales. For brands that need to track these nuances closely, exploring customized reporting solutions can offer a much clearer picture of what's driving performance over time.
The All-Important Buy Box Metric
On every Amazon product page, there's a white box on the right where customers can add an item to their cart. That's the Buy Box, and winning it is everything. Why? Because a staggering 82% of all Amazon sales go through it.
Your Buy Box Percentage tells you how often your product is the one featured in that box. If it’s low, it means your competitors are snatching sales right from under your nose—even on your own listing if you have resellers.
Several things influence who wins the Buy Box, including price, fulfillment method (FBA is heavily favored), and your overall seller performance. Monitoring this metric isn't just a good idea; it's non-negotiable for anyone serious about succeeding on Amazon. A drop in this percentage is almost always a direct warning of a coming drop in sales.
How to Access Your Amazon Sales Data

Knowing your metrics is one thing, but finding them can feel like a totally different challenge. Your Amazon sales data isn't all in one neat pile; it's spread across several reports and dashboards, each built for a specific job. Think of Seller Central less like a single screen and more like a control room with multiple monitors.
Your main screen for checking the daily pulse of your business is Business Reports. This is where you’ll find the vital signs—sales, traffic, and conversion rates—all laid out. For more proactive advice, the Amazon Selling Coach acts like a helpful nudge, sending you alerts when a popular item is about to run out of stock.
These built-in tools are your first and most important stop for getting a handle on your performance.
Navigating Seller Central for Key Reports
The heart of your data lives inside Amazon Seller Central. It can look overwhelming at first glance, but most of the information you need for day-to-day decisions is tucked into one primary area. Getting comfortable here is the first real step toward running your business on data, not just gut feelings.
Here’s the simple path to your most valuable reports:
- Log in to your Amazon Seller Central account.
- Hover over the Reports tab in the top navigation bar.
- From the dropdown menu, click on Business Reports. This is your command center.
Inside Business Reports, you'll find a goldmine of information that you can filter by date or by specific products (ASINs). This lets you zoom in on how a single product is doing or pull back to see the bigger picture of your brand's performance over time.
When to Use Advanced Data Tools
Seller Central’s reports are perfect for daily health checks and routine analysis. But as your business grows, you'll eventually hit their limits. When you need to do deep strategic planning, process huge amounts of data, or see what your competitors are up to, you’ll have to look beyond the basics.
This is where the more advanced tools come into play:
- Amazon Marketplace Web Service (MWS) API: This is essentially a direct pipeline into your Amazon data. The MWS API lets developers build custom software that automatically pulls massive volumes of sales, inventory, and order information. It's a must-have for larger businesses with complex reporting needs or those wanting to feed Amazon data into their own internal systems.
- Third-Party Analytics Platforms: Tools like Helium 10, Jungle Scout, or Viral Launch offer powerful analytics suites that go way beyond what Seller Central can do. They not only visualize your own sales data in more intuitive ways but also provide priceless competitive intelligence, like keyword rankings, competitor sales estimates, and market trend analysis.
The right tool always depends on the job. For a quick sales check, Seller Central is perfect. For a full-blown market analysis before launching a new product, a third-party tool is non-negotiable.
Choosing the right platform is a major strategic decision. Before you commit, it’s smart to run a thorough marketplace evaluation test to figure out which channels and tools are the best fit for your specific business goals.
Choosing Your Data Retrieval Method
Deciding how to access your Amazon sales data really boils down to one simple question: What problem are you trying to solve right now? The goal is to match the tool to the complexity of the task.
Here’s a straightforward guide to help you choose:
| Task Complexity | Recommended Tool | Primary Use Case |
|---|---|---|
| Simple | Amazon Seller Central | Daily sales check-ins, monitoring traffic for a specific ASIN, reviewing basic conversion rates. |
| Intermediate | Third-Party Platforms | Competitor analysis, keyword research, optimizing PPC campaigns, forecasting inventory needs. |
| Advanced | MWS API or Custom Solutions | Building custom dashboards, integrating Amazon data with other business systems (like a CRM), automating reports. |
By starting with the foundational reports in Seller Central and expanding to more powerful tools as your needs grow, you can build a solid system for collecting and analyzing the data that truly matters to your bottom line.
Proven Techniques for Analyzing Your Data
Collecting your Amazon sales data is just the first step. The real value comes from knowing how to actually read the story it tells. Raw numbers on a dashboard are a lot like individual musical notes—they only create a melody when you arrange them in a meaningful way. This is where analysis turns a simple record of what happened into a clear roadmap for what to do next.
Moving from data collection to real action means applying a few specific techniques. These methods will help you spot patterns, see where you stand against the competition, and make smarter decisions on everything from your marketing budget to your inventory levels. When you learn to analyze your data effectively, you stop reacting to problems and start building a proactive strategy.
Spotting Patterns with Trend Analysis
One of the most powerful things you can do with your sales data is look for trends over time. Trend analysis is really just the practice of examining data from different periods—like weeks, months, or even years—to identify recurring patterns or shifts in performance. It’s how you discover the natural rhythm of your business.
For example, by looking at your Units Ordered metric over the last 12 months, you might discover that a certain product’s sales spike every November. That isn't just a random fluctuation; it's a clear seasonal trend. Armed with that insight, you can prepare by:
- Increasing inventory ahead of the peak season to avoid costly stockouts.
- Launching targeted ad campaigns in October to capture early holiday shoppers.
- Adjusting your pricing strategy to maximize profit when demand is at its highest.
Without trend analysis, that November spike is just a nice surprise. With it, it becomes a predictable, profitable event you can actually plan for.
Benchmarking Against the Competition
Your sales data doesn't exist in a vacuum. A 10% jump in sales might feel like a huge win, but what if your top competitor grew by 30% in the same period? Benchmarking gives you that crucial context by comparing your performance metrics against industry averages or direct competitors.
While Amazon won’t hand you your competitor's data, you can use third-party analytics tools to get a good estimate of their sales velocity, keyword rankings, and pricing strategies. This helps you answer some critical questions:
- Is my conversion rate (Unit Session Percentage) above or below the category average?
- Are my prices competitive enough to consistently win the Buy Box?
- How does my sales growth stack up against the overall market trend?
Benchmarking turns your internal data into a competitive intelligence tool. It helps you understand not just how you're doing, but how you're doing relative to everyone else—which is what ultimately determines market share.
Forecasting for Inventory and Marketing
Perhaps the most practical use for your Amazon sales data is forecasting. When you combine historical sales data with trend analysis, you can make surprisingly accurate predictions about future demand. This is absolutely essential for preventing the two biggest inventory mistakes: overstocking and understocking.
Imagine you just wrapped up a major PPC campaign. Correlating your ad spend data with the sales data from that period is a perfect example of analysis in action. Did that extra ad spend actually lead to a proportional lift in sales? By calculating your Advertising Cost of Sale (ACoS), you can figure out the exact return on your investment. This is a core part of building effective, data-driven advertising solutions that scale your business without burning through cash.
The same logic applies directly to your inventory. If your data shows you sell an average of 50 units a day and your supplier has a 14-day lead time, you know you need to reorder when your stock drops below 700 units. To do this effectively, you need the right tools. Dedicated ecommerce analytics software can be a game-changer, automating these calculations and giving you much deeper insights.
Turning Data Insights Into Business Growth
Collecting and analyzing your Amazon sales data gets you to the starting line, but this is where the race is won. It’s the part where all that hard work actually turns into profit.
Think of your data as a detailed blueprint. On its own, it’s just a piece of paper. But in the hands of a skilled builder, it becomes a solid foundation for a thriving structure. Your metrics are just numbers until you start using them to build smarter business strategies.
Successful sellers don't just glance at their data; they live in it. They use the insights to make calculated decisions that drive real, tangible results, turning their Seller Central dashboard from a simple report card into a powerful growth engine. This is how you stop just running a store and start actively steering a business.
Optimizing Listings with Conversion Data
Your Unit Session Percentage—or conversion rate—is one of the most powerful and direct metrics you have. A low rate is a blinking red light telling you that your product page isn’t convincing shoppers to buy, even if your ads are driving tons of traffic.
This is where strategic A/B testing becomes your best friend. A/B testing, also known as split testing, is a simple concept: you create two versions of a single listing element to see which one performs better. By changing just one thing at a time—like the main image, the title, or the very first bullet point—you can scientifically measure its impact on your conversion rate.
Here’s how it works in the real world:
- Hypothesis: Your main product image isn’t doing a good enough job of grabbing attention.
- Test: For one week, run your listing with Version A (your current image) and track the conversion rate. The following week, swap it out for Version B (a new lifestyle image showing the product in use) and track the new rate.
- Analysis: If Version B brings in a higher conversion rate, you have a clear winner. Just like that, you’ve made a data-driven change that can lead to a lasting increase in sales—without spending another dime on ads.
Refining PPC Campaigns with Traffic Data
Throwing money at Amazon PPC campaigns without digging into the data is like trying to hit a target with a blindfold on. Your advertising reports are packed with insights telling you exactly which keywords are driving sales and which ones are just burning through your budget. The goal is to focus your ad spend on high-performing, high-traffic keywords.
Dive into your search term reports and find the exact phrases customers are typing to find and buy your products. You’ll almost certainly discover that a small handful of keywords are responsible for the vast majority of your sales. It’s time to double down on these winners by increasing their bids.
At the same time, you need to be ruthless about cutting the losers. If a keyword is getting plenty of clicks but zero conversions, it’s dead weight. Add it to your negative keywords list immediately. This one move prevents your ad from showing up for irrelevant searches, which instantly improves your Advertising Cost of Sale (ACoS). For a deeper dive on turning analytics into action, this guide to winning with revenue analytics is a great resource.
Informing Product Strategy with Sales Velocity
Your historical Amazon sales data is a crystal ball for making future product decisions. By analyzing sales velocity—the speed at which your products are selling—you can spot your rising stars and identify products that might be nearing the end of their lifecycle. This information is pure gold for both inventory management and new product development.
For example, if you notice a particular product's sales velocity is climbing steadily month after month, that’s a loud and clear signal of growing market demand. This single insight can inform your next strategic move:
- Expand the Product Line: Think about launching new variations like different colors or sizes to appeal to a wider audience.
- Bundle Products: Pair your hot-selling item with a complementary, slower-moving product to boost your average order value.
- International Expansion: The proven demand might mean it's the perfect time to launch the product in other Amazon marketplaces.
These kinds of strategic bets feel a lot less risky when they're backed by solid sales trends. For those looking to explore more growth tactics, our guide on how to improve Amazon sales offers more proven methods.
The Amazon marketplace is a dynamic environment, but one fact remains constant: it's a platform built for independent sellers. With the right data-driven approach, small and medium-sized businesses can achieve remarkable success.
The scale of this opportunity is massive. Over 60% of all sales on Amazon now come from independent sellers, most of whom are small and medium-sized businesses. In 2024, independent sellers in the U.S. averaged more than $290,000 in annual sales, with over 55,000 of them crossing the $1 million mark. This incredible ecosystem, fueled by more than 200 million Prime members, proves that data-backed strategies are the key to unlocking serious growth.
Common Mistakes to Avoid With Amazon Data

Even seasoned Amazon sellers fall into data traps. Getting your hands on powerful Amazon sales data is only half the battle; knowing how to read it is what separates the brands that scale from the ones that stagnate. Spotting these common mistakes is the first step to building smarter, more profitable habits.
One of the biggest blunders is chasing vanity metrics. High revenue looks great on a dashboard, but it’s a dangerously incomplete picture. A product pulling in $100,000 in sales with a tiny 5% profit margin is far less healthy than one bringing in $50,000 at a 40% margin. You have to prioritize profit over raw revenue—always.
Misinterpreting Short-Term Data Fluctuations
Another all-too-common mistake is overreacting to daily spikes and dips. A sudden sales surge feels like a win, but what if it was just a one-off promotion you can't repeat? On the flip side, one slow day doesn't mean your product is suddenly failing.
Always look for the long-term trend, not the daily noise. Context is everything when analyzing your sales data; otherwise, you risk making knee-jerk decisions based on incomplete information.
The fix is simple: expand your date range. Look at your performance over several weeks or months to see what the real patterns are. This stops you from overcorrecting for a single outlier and helps you build a more stable, predictable strategy.
Ignoring Critical Inventory Data
Perhaps the costliest mistake of all is ignoring your inventory metrics until it's an emergency. A stockout on Amazon is a total disaster. It’s not just about the lost sales—it tanks your sales velocity and keyword rankings, making it that much harder to climb back once you’re restocked.
To stay ahead of this, you need to live and breathe two key data points:
- Sales Velocity: How many units you’re selling per day, on average.
- Lead Time: How long it takes for new inventory to get from your supplier to Amazon’s warehouse, ready to sell.
By keeping a close eye on these numbers, you can nail down your reorder point with precision. It’s the difference between never running out of your best-sellers and scrambling to recover from a preventable stockout. Proactive inventory management is a direct result of paying attention to the right data.
Frequently Asked Questions About Amazon Sales Data
Diving into Amazon sales data usually brings up a handful of common questions. Getting clear, practical answers is the first step toward building the kind of data-driven habits that actually grow your store. Here are some of the most common questions we hear, along with some straightforward advice.
How Often Should I Check My Sales Data?
It’s tempting to hit refresh on your dashboard every hour, but that’s rarely a productive use of your time. The best cadence really depends on what you're trying to figure out.
- Daily Checks: Look at your fast-moving numbers like Total Sales, Sessions, and Units Ordered. This is your early warning system—it helps you spot sudden drops that could signal a problem with your ads or listings before they do real damage.
- Weekly Analysis: This is the perfect time to review trends in your Unit Session Percentage (your conversion rate) and Buy Box Percentage. Looking at these weekly smooths out the daily noise and gives you a much clearer picture of your performance.
- Monthly Reviews: Zoom out for the big picture. Use this time to analyze longer-term trends, see how your advertising ROI is really doing, and forecast your inventory needs for the next month. This is where strategy happens.
What Are the Best Tools Besides Seller Central?
Amazon Seller Central is your starting point, but it's not the finish line. For the kind of deep analysis and competitive intel you need to get ahead, third-party tools are essential. Platforms like Helium 10, Jungle Scout, and Viral Launch offer powerful features that Seller Central just doesn’t have.
These tools give you a window into keyword rankings, competitor sales estimates, and broader market trends. They help you understand not just how you're doing, but where you stand in the market—and that’s a critical piece of the puzzle for growth.
How Do I Predict Future Inventory Needs?
Using your sales data to predict inventory needs is one of its most powerful applications. Start by figuring out your average daily sales velocity for each product over the last 30 to 60 days.
Next, you need to know your supplier’s lead time—that’s the total time it takes from when you place an order until the inventory is checked in and ready to sell at an Amazon FBA warehouse. To find your reorder point, just multiply your daily sales velocity by your lead time in days.
For example, if you sell 20 units a day and your supplier’s lead time is 30 days, you need to place a new order when you have 600 units left. This simple math is your best defense against a costly stockout.
What Is a Good Conversion Rate on Amazon?
Honestly, a "good" conversion rate—or Unit Session Percentage—can be all over the place depending on your product category, price, and how fierce the competition is. That said, a solid benchmark for a healthy Amazon conversion rate is usually somewhere between 10% and 15%.
If your rate is dipping below 5%, that’s often a red flag. It could point to a problem with your listing, like weak images, uninspired copy, a string of bad reviews, or pricing that just isn't competitive. The only sure way to push that number up is to track it consistently and A/B test different parts of your listing over time.
At Next Point Digital, we turn confusing data into clear, actionable strategies that actually move the needle. Our team is here to help you optimize your marketplace presence, run smarter advertising, and build a profitable path forward on Amazon and beyond. Learn how we can make your data work for you at https://npoint.digital.