Relying on a single, blended Customer Acquisition Cost (CAC) is a recipe for wasted ad spend. That one simple number feels clean, but it hides critical inefficiencies, making it impossible to know which marketing efforts are actually profitable and which are just draining your budget.
Think of a detailed customer acquisition cost calculator as a diagnostic tool. It’s what reveals the true performance of each channel so you can build sustainable growth, not just vanity metrics.
Why a Simple CAC Formula Is Costing You Money
Let's be honest: using a single, blended CAC number is easy. You add up your total marketing and sales costs, divide by the new customers you got, and you have a metric. But that convenience comes at a steep price, often leading to flawed strategic decisions that create a dangerous illusion of profitability.
Imagine a D2C brand spending $10,000 a month across Google Ads and Facebook Ads. They acquire 200 new customers, giving them a blended CAC of $50. If their average order is $150, this looks like a huge win. The leadership team might even decide to double down on the budget based on this "success."
The Danger of a Blended Average
But when you break it down by channel, a completely different story emerges. A proper customer acquisition cost calculator forces you to dig deeper.
What if the real numbers looked like this?
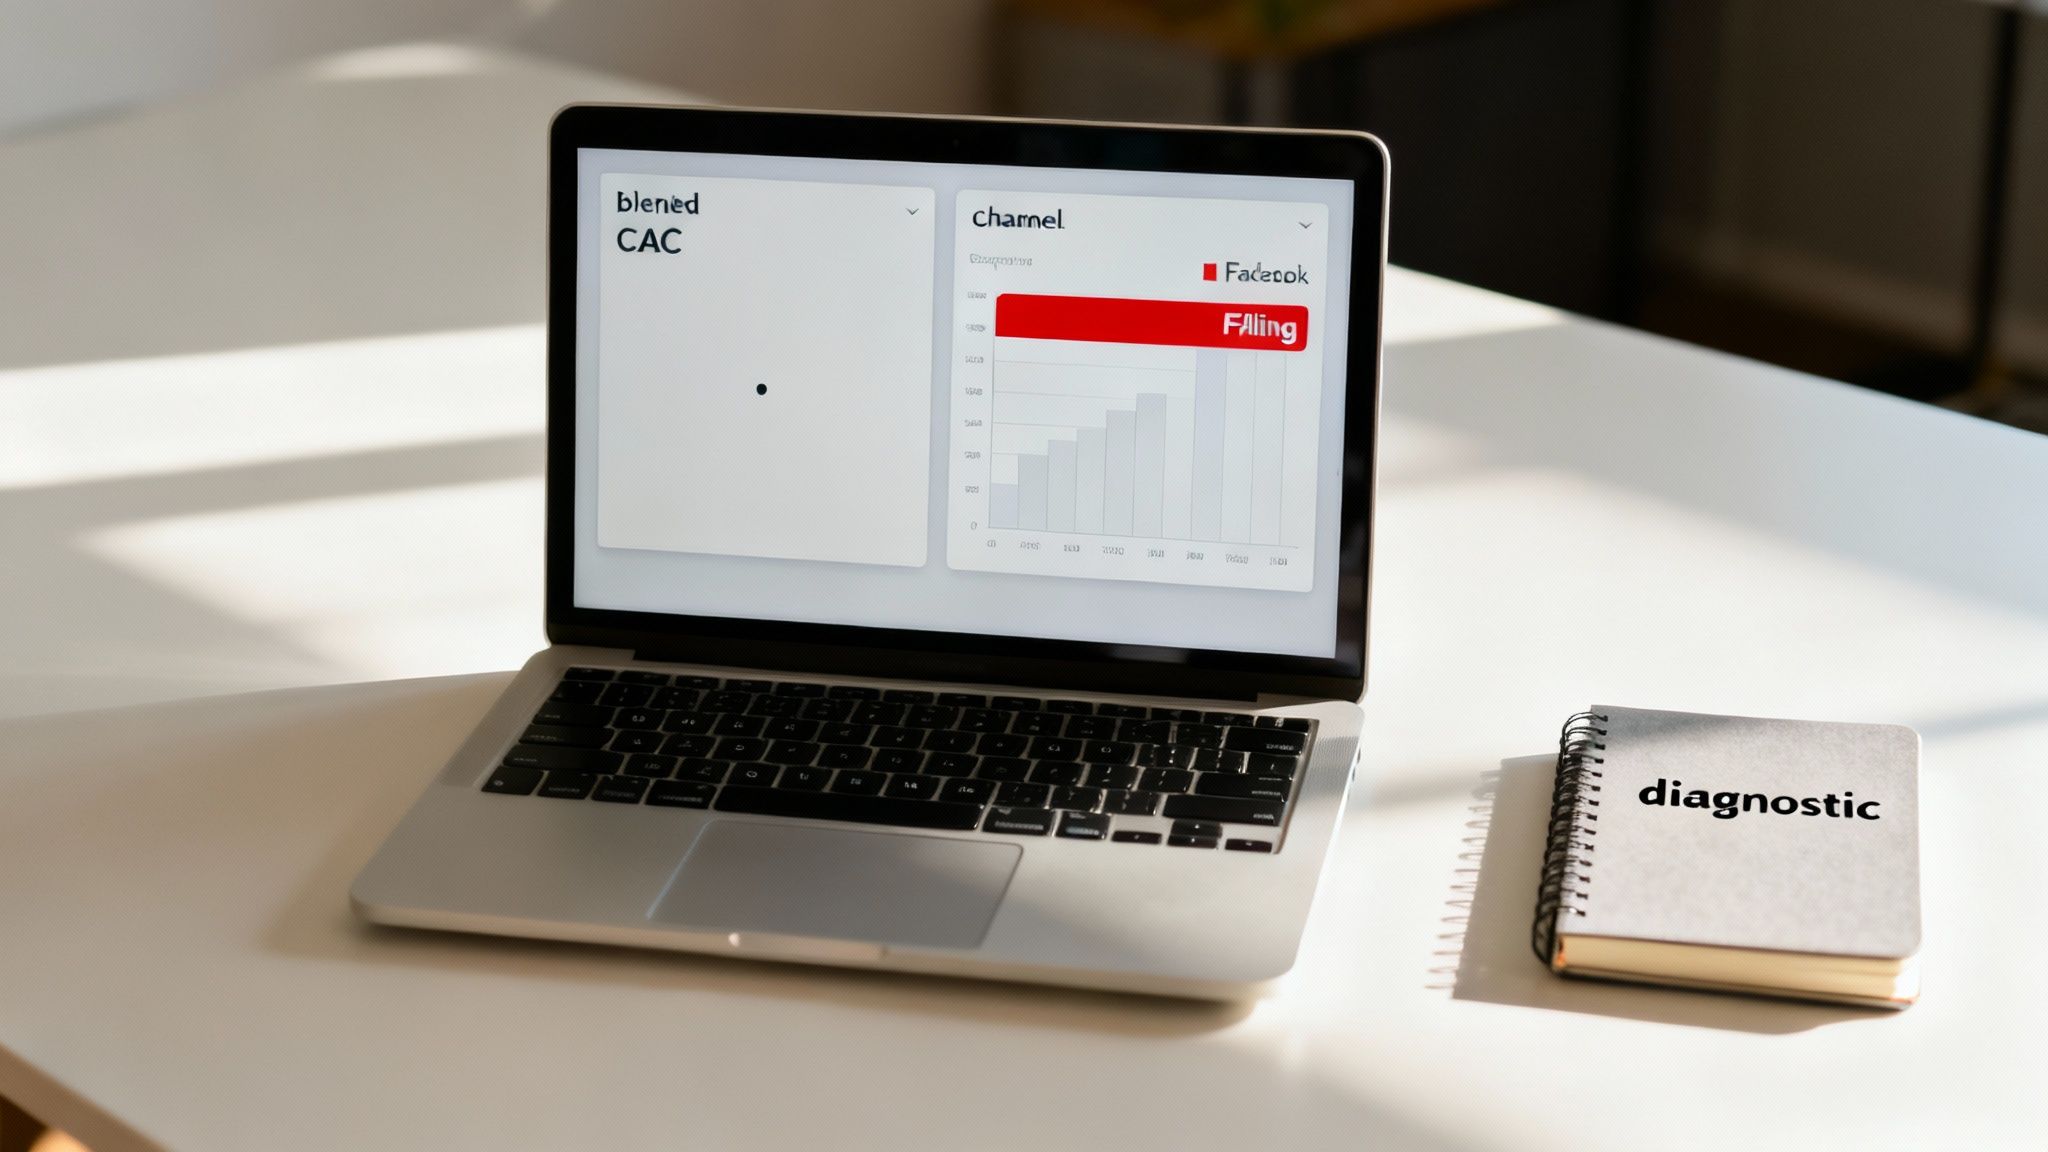
- Google Ads: $5,000 spend / 150 new customers = $33.33 CAC
- Facebook Ads: $5,000 spend / 50 new customers = $100.00 CAC
Suddenly, the picture is much clearer. The Google Ads campaign is incredibly efficient, pulling in customers for far less than the blended average. On the other hand, the Facebook Ads campaign is twice as expensive and might actually be losing money once you factor in COGS and other operational expenses.
By relying only on the blended $50 CAC, the brand would have kept pouring money into a failing Facebook campaign, totally unaware it was being propped up by their success on Google. This is the core problem with a simple formula—it treats all customers and all channels as equal, when they are anything but.
Beyond Channels: The Need for Deeper Insights
This problem goes way beyond just ad platforms. A blended CAC fails to account for all the little nuances that actually drive profitability. Without a more detailed calculator, you’re essentially flying blind, unable to answer critical business questions like:
- Which specific campaign is driving the highest-value customers?
- Does our organic SEO traffic convert at a lower cost than paid social?
- Are customers acquired during a holiday sale less loyal long-term?
Answering these questions means moving from a simple calculation to a dynamic diagnostic tool. By segmenting your costs and customer data, you can uncover the true winners and losers in your marketing mix. This granular approach is the foundation of effective, data-driven marketing strategies that fuel scalable growth instead of just burning cash.
A sophisticated calculator doesn't just give you a number; it gives you a roadmap for smarter spending and sustainable success.
Gathering the Right Data for Your CAC Calculator
Your customer acquisition cost calculator is only as good as the data you feed it. That old saying, "garbage in, garbage out," isn't just a cliché; it's a financial liability when you're making real budget decisions. To get a true picture of your acquisition costs, you have to dig much deeper than just your monthly ad spend on Google or Meta.
The goal here is a "fully loaded" CAC. This means you're accounting for every single dollar that went into winning a new customer. Too many businesses make the classic mistake of only tracking direct ad spend, which gives them a deceptively low CAC and a dangerous false sense of security.
Identifying Your True Sales and Marketing Expenses
To build a calculator you can actually trust, you need to hunt down a complete list of all associated costs. These expenses are often scattered across different departments, software, and spreadsheets, so be prepared to do some digging. Think of it as a full-blown audit of your entire growth engine.
Here’s a practical checklist of the data points you absolutely need to track down:
- Direct Ad Spend: This is the obvious one. It’s the total amount you’re spending on platforms like Google Ads, Facebook Ads, TikTok Ads, and any other paid channels.
- Team Salaries and Commissions: This is critical. You have to include the prorated salaries of your marketing and sales teams. If a marketer spends 100% of their time on acquisition, their full salary is a cost. If they spend 50% on acquisition and 50% on retention, you’d include half their salary. Don't forget commissions, either.
- Agency and Freelancer Fees: Do you work with a marketing agency, a freelance copywriter, or a paid media specialist? Their retainers and project fees are direct acquisition costs.
- Software and Tool Subscriptions: This category gets overlooked all the time. Include the costs for your CRM, your email marketing platform (like Klaviyo), your analytics tools (like Ahrefs), and any other software used to attract or convert customers.
- Creative Production Costs: Did you hire a photographer for a product shoot or a video editor for a new ad? Those creative expenses are all part of the total cost.
A common mistake is to treat a blended CAC as a static, one-size-fits-all number. Experts increasingly agree this is a misleading approach. Acquisition costs vary wildly depending on where a customer is in your funnel. A top-of-funnel campaign targeting a brand-new audience will naturally have a much higher CAC than a retargeting campaign aimed at people who already know your brand.
Pinpointing Your Data Sources
Now that you know what to look for, the next question is where to find it. Your data is almost certainly living in a few different systems. Pulling it all together is the first real step in building your calculator.
Here are the most common places you'll need to pull numbers from:
- Advertising Platforms: Your ad spend data comes straight from your dashboards on Google Ads, Meta Business Suite, TikTok Ads Manager, and so on. Export monthly or quarterly reports to keep things consistent.
- Accounting Software: Tools like QuickBooks or Xero are your source of truth for salaries, agency retainers, and software subscriptions. Your P&L statement should have most of this already categorized for you.
- E-commerce Platform: Your Shopify, BigCommerce, or WooCommerce dashboard is where you'll find the number of new customers acquired in a given period. Make sure you filter out returning customers to keep your calculation clean. For marketplace sellers, getting accurate reports is just as vital; you'll need to master pulling and interpreting your Amazon sales data or similar reports from eBay and Walmart.
- Analytics Tools: Google Analytics is invaluable for attributing new customers to specific channels, especially organic ones like SEO. If you have proper conversion tracking set up, you can see how many new customers came from organic search versus a specific paid campaign.
Gathering this information diligently is the most important part of the entire process. An incomplete or inaccurate dataset will render your customer acquisition cost calculator useless, leading you right back to making the flawed decisions you're trying to avoid.
Building Your Calculator From the Ground Up
Alright, it's time to roll up our sleeves and build this thing. Forget about expensive, complicated software for a minute. You can create an incredibly powerful customer acquisition cost calculator with a simple spreadsheet, and I'll walk you through how. We'll start with the basic formula and then immediately start layering in the details that turn it from a simple number into a strategic weapon.
The textbook formula is pretty simple: Total Sales & Marketing Costs / New Customers Acquired. But as we've already touched on, its simplicity is its biggest weakness. A truly useful calculator tells the story behind the numbers. So let's get your spreadsheet structured the right way from the start.
This diagram shows the basic flow of data you need to capture. It's all about tracking expenses, assigning them to the right marketing channels, and then connecting that spend to the new customers you brought in.
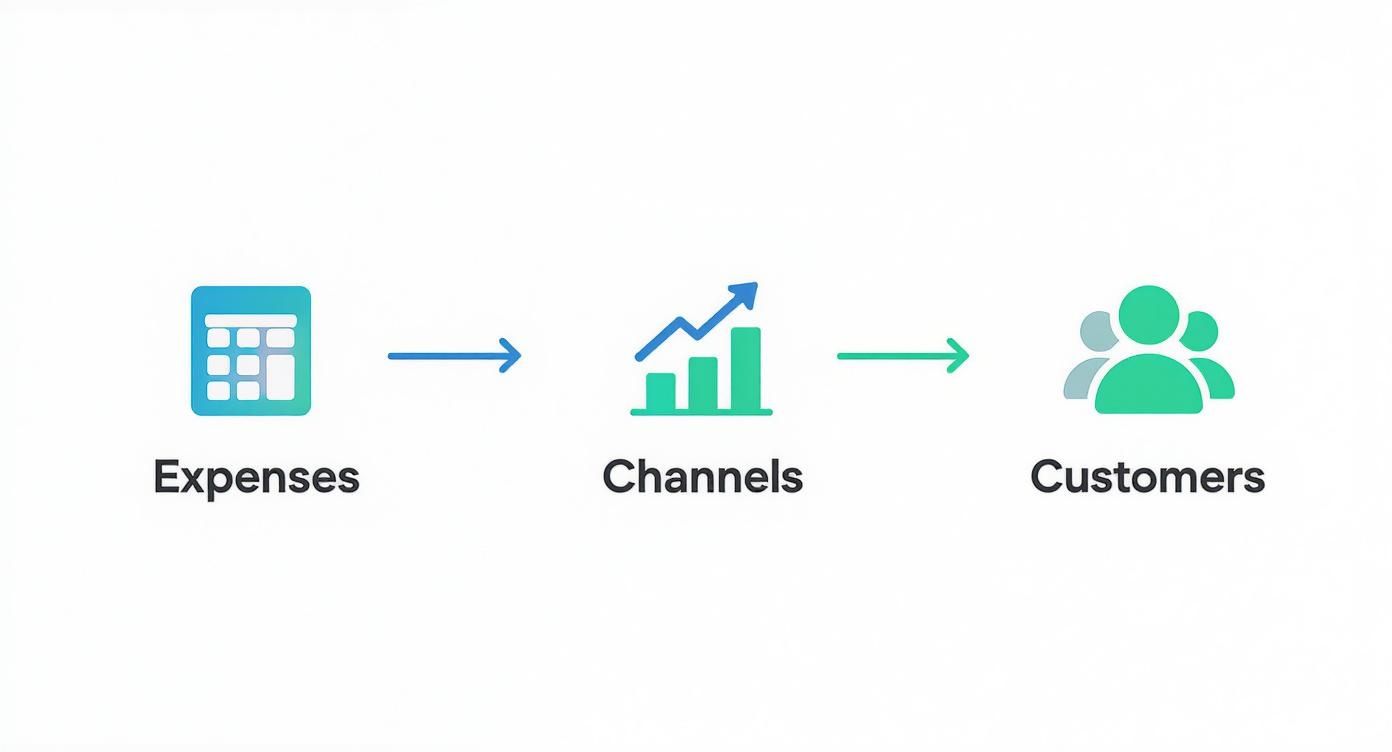
Follow this logic, and you’ll make sure every relevant cost gets counted and properly assigned. The result is a far more accurate and actionable metric.
Essential Formulas for Your CAC Calculator
Before we dive into the setup, let's get the core math straight. These are the formulas that will power your entire calculator, from the high-level overview to the granular, channel-specific insights.
| Metric | Formula | Example Data Input |
|---|---|---|
| Basic CAC | Total Sales & Marketing Costs / New Customers | $10,000 Spend / 200 Customers |
| Channel-Specific CAC | Total Channel Costs / New Customers from Channel | $5,000 Google Ads Spend / 100 Customers from Google |
| Fully-Loaded CAC | (All Sales & Marketing Costs + Salaries + Software + Overhead) / New Customers | ($10,000 Spend + $5,000 Salaries) / 200 Customers |
Having these formulas ready to go in your spreadsheet is the first step. Now, let's build the structure to feed them the right data.
Setting Up Your Spreadsheet Tabs
To keep things clean and scalable, I always recommend organizing your calculator with separate tabs. This stops your main dashboard from becoming a cluttered mess and makes it way easier to update specific data points without breaking everything.
A solid starting structure uses these four tabs:
- Main Dashboard: Think of this as your command center. It pulls data from the other tabs to show your blended CAC, your LTV:CAC ratio, and how your key channels are performing at a glance.
- Cost Inputs: This is just a detailed ledger for every single expense. You'll list everything here—ad spend per channel, prorated salaries, software fees, you name it.
- Channel Performance: This is where the magic really happens. You'll set up columns for each marketing channel (Google Ads, TikTok, SEO, etc.) to track its specific spend and the number of new customers it actually delivered.
- Customer Data: A simple tab for tracking the total number of new customers acquired in a given period, which you can pull straight from your e-commerce platform or CRM.
This segmented approach keeps your data organized and makes troubleshooting any formula errors a breeze later on.
Populating the Cost Inputs Tab
Your "Cost Inputs" tab is the foundation for everything else, so accuracy is key. Create a simple table with columns for Date, Cost Category, Specific Item, and Amount. You need to be meticulous here.
For example, your entries for a single month might look something like this:
| Date | Cost Category | Specific Item | Amount |
|---|---|---|---|
| 2024-10-31 | Ad Spend | Google Ads | $5,000 |
| 2024-10-31 | Ad Spend | TikTok Ads | $3,500 |
| 2024-10-31 | Salaries | Marketing Manager (50%) | $3,000 |
| 2024-10-31 | Software | Ahrefs Subscription | $179 |
| 2024-10-31 | Agency Fees | SEO Consultant | $2,000 |
Pro Tip: Use data validation in your spreadsheet for the 'Cost Category' column. This creates a dropdown menu (e.g., Ad Spend, Salaries, Software), ensuring consistent entries and making it super easy to tally up categories later with a
SUMIFformula.
Calculating Channel-Specific CAC
This is where your calculator goes from a vanity metric to a genuine decision-making tool. In your "Channel Performance" tab, you'll pull the specific costs for each channel and divide them by the customers acquired from that exact channel.
Your setup will be straightforward:
- Column A: Channel Name (Google Ads, Facebook Ads, SEO Content)
- Column B: Total Spend (Pulled from your 'Cost Inputs' tab)
- Column C: New Customers Acquired (Pulled from Google Analytics or platform data)
- Column D: Channel CAC (Your formula:
=B2/C2)
This detailed breakdown is what allows you to stop guessing and start making data-backed decisions. You might discover that one channel is an absolute workhorse while another is just a cash drain—an insight that's completely invisible when you only look at a blended CAC.
Factoring in the Nuanced Costs
Don't stop at the obvious expenses. So many businesses forget the "hidden" costs that are still part of customer acquisition. I'm talking about things like payment processing fees (from Stripe or PayPal) that chip away at your margin on every single sale. These are real costs of doing business and acquiring that customer's revenue.
Here's a simple way to account for them:
- Calculate an average fee percentage: Dig into your payment processor reports to find your average fee (e.g., 2.9% + $0.30 per transaction).
- Apply it to your revenue: On your main dashboard, you can subtract this from your Lifetime Value (LTV) calculation. This gives you a much more realistic picture of profitability.
These small details are crucial. They contribute to the total cost of a transaction, which directly impacts how much you should be willing to spend on acquisition. In fact, understanding these nuanced costs is a critical piece of the puzzle when you're figuring out how to determine the price of a product to ensure you're profitable from the very first sale.
By building this detailed, multi-tabbed calculator, you're moving beyond a simple, often misleading number. You're creating a dynamic tool that gives you true clarity on your marketing performance.
So, you’ve wrestled with spreadsheets, pulled all your data, and finally have your Customer Acquisition Cost. Now what?
You’re staring at a number. Is it good? Is it a disaster?
Truth is, a CAC figure all by itself is just a number on a page. It doesn't tell you a thing about the actual health of your business. The real magic happens when you put that number into context with other key metrics. This is where you stop just reporting data and start using it to make smart business decisions.
To get the full story, we need to look at two other crucial pieces of the puzzle: your LTV:CAC ratio and your CAC Payback Period. These two metrics will tell you if your acquisition strategy is sustainable, profitable, or bleeding cash.
The LTV to CAC Ratio Explained
The LTV:CAC ratio is the gold standard for measuring if your acquisition efforts are actually making you money in the long run. It’s a simple comparison: how much is a customer worth to you over their lifetime versus how much you paid to get them in the door?
Essentially, it answers the big question: "Are we making more from our customers than we're spending to acquire them?"
First, you'll need your customer lifetime value (LTV). A quick way to get a solid estimate is:
- (Average Order Value) x (Average Purchase Frequency) x (Average Customer Lifespan)
Once you have your LTV, the ratio is a piece of cake:
- LTV / CAC = Your Ratio
Let's say your average customer LTV is $300, and your fully-loaded CAC comes out to $100. Your LTV:CAC ratio is 3:1. For most e-commerce and D2C brands, this is the sweet spot.
A 3:1 ratio is fantastic. It means for every dollar you spend bringing in a new customer, you get three dollars back over their lifetime. This gives you enough margin to cover your other business costs and still turn a healthy profit. It’s a sign of a sustainable, scalable model.
But not all ratios are created equal.
- A 1:1 Ratio: This is a five-alarm fire. You're losing money on every single customer you acquire once you account for the cost of goods and other operational expenses.
- A 5:1 Ratio or Higher: This might look like a dream, but it often means you're leaving money on the table. A ratio this high suggests your acquisition engine is incredibly efficient, and you should probably be spending more aggressively to capture market share before a competitor does.
Getting a handle on this ratio is a game-changer. It shifts your entire mindset from chasing cheap clicks to acquiring high-value, profitable customers. It's no surprise that improving this metric is a key focus of ongoing conversion rate optimization best practices.
Calculating Your CAC Payback Period
Next up is the CAC Payback Period. This metric tells you exactly how long it takes to earn back the cash you invested to acquire a new customer.
Why does this matter so much? Cash flow. A shorter payback period means you're not waiting months (or years!) to recoup your marketing spend.
The formula is straightforward:
- (CAC) / (Average Monthly Revenue per Customer) = Payback Period in Months
Imagine your CAC is $200, and your average customer brings in $50 in revenue each month. Your payback period is a tidy four months ($200 / $50). After month four, every dollar that customer spends is pure profit flowing back into your business.
While SaaS companies often use a margin-adjusted version of this, for e-commerce, using total revenue gives a crystal-clear picture of your cash flow.
Ideally, you want your payback period to be under 12 months. The faster you get your money back, the faster you can reinvest it into acquiring even more customers. This is how you build a powerful, self-sustaining growth loop. And just like knowing your paid CAC is vital, understanding how to measure SEO ROI helps you see how organic efforts can dramatically shorten this payback timeline.
Using These Insights to Scale Confidently
Let's put this into a real-world scenario. A D2C brand discovers its CAC is $60. They calculate their LTV at $210, giving them a healthy 3.5:1 ratio. Better yet, their payback period is just three months.
Now, when their marketing team proposes doubling the Google Ads budget, the leadership team doesn't have to guess. They can approve it with confidence, knowing the investment is backed by a profitable and sustainable acquisition model.
This context is also critical when you're looking at industry benchmarks. What’s considered a high CAC in one niche is perfectly normal in another. For example, the average CAC in e-commerce hovers around $50, but for a B2B SaaS company, a CAC of $1,200 might be completely reasonable.
By moving beyond the raw CAC number and focusing on these two critical ratios, your calculator transforms from a simple reporting tool into a strategic roadmap for profitable growth.
Proven Strategies to Lower Your Acquisition Costs
With a detailed customer acquisition cost calculator in hand, you're no longer guessing. You have a clear map showing which channels are profitable and which ones are just draining your budget. Now it’s time to use those insights to optimize your spending and actively lower your acquisition costs—without sacrificing growth.
This isn't about slashing your marketing budget across the board. It's about surgical precision. You need to trim the fat and reallocate resources to the strategies that actually deliver a return.
Double Down on Conversion Rate Optimization
One of the most powerful levers you can pull to lower your CAC is Conversion Rate Optimization (CRO). Think about it: if you can get more of your existing visitors to buy, you acquire more customers from the exact same ad spend. This directly slashes your cost per acquisition.
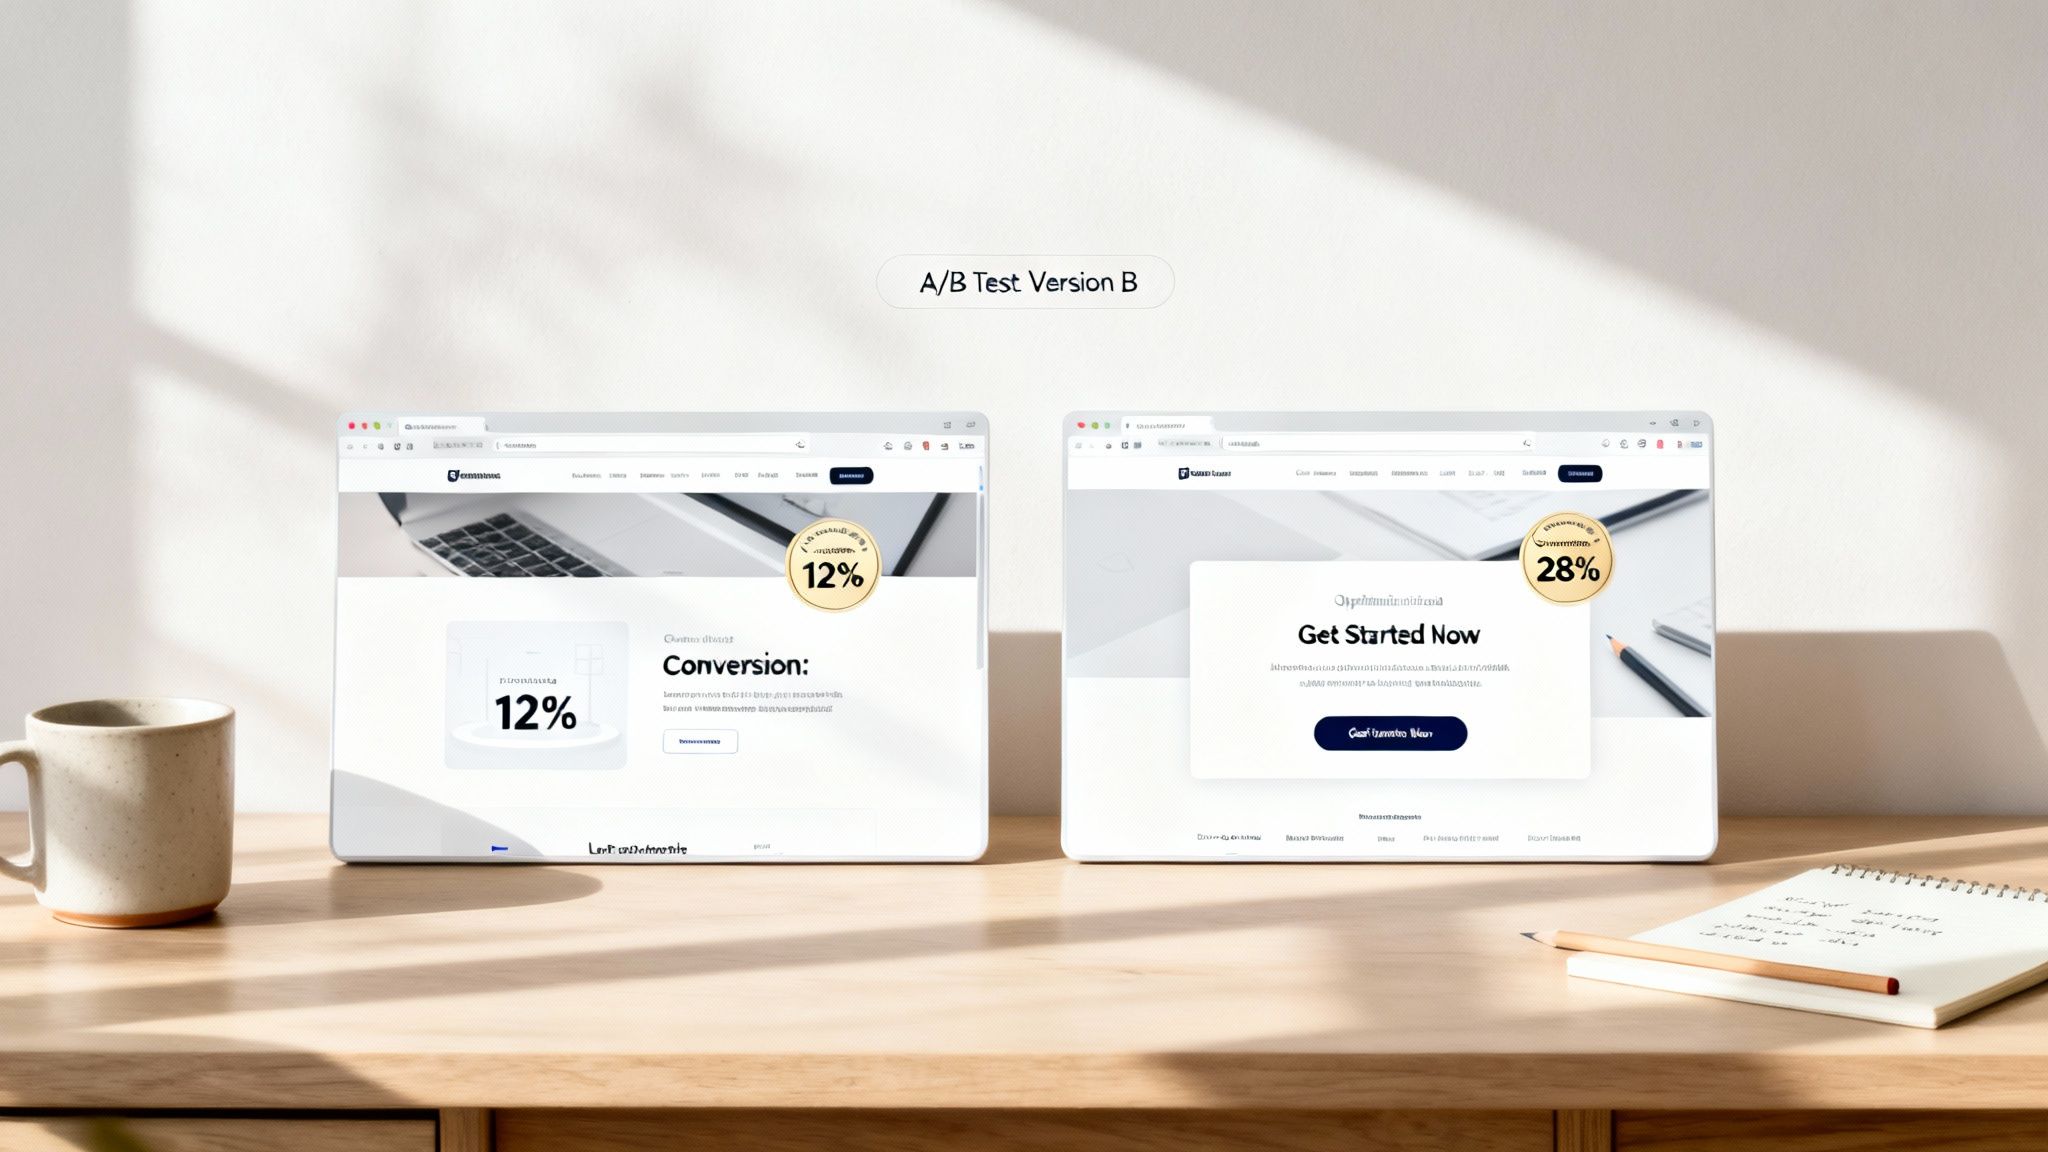
Start with your highest-traffic pages, like your homepage or top product pages, and run systematic A/B tests. The key is to test one element at a time to get clean, reliable data.
- Headline: Does a benefit-driven headline work better than a product-focused one?
- Call to Action (CTA): Test "Buy Now" against "Add to Cart." Experiment with button colors, sizes, and placements.
- Product Images: Do lifestyle photos convert better than simple product shots on a white background?
For example, an e-commerce store selling outdoor gear noticed a high cart abandonment rate. They A/B tested their checkout page, creating a new version with trust badges (like secure payment icons) and a clear "30-Day Money-Back Guarantee" message. The new version increased their checkout conversion rate by 18%, which directly lowered their overall CAC for paid traffic.
Refine Your Ad Targeting and Creative
Paid advertising is often the biggest line item in a marketing budget, making it a prime target for optimization. Poor targeting is like throwing money into a black hole—you're paying to show ads to people who will never buy your product. This is where your channel-specific CAC data becomes invaluable.
If you see that TikTok Ads have a sky-high CAC compared to Google Ads, it's time to investigate. Dig into your audience demographics, interests, and placements to find pockets of inefficiency.
For more specific tactics, particularly within the Google Ads ecosystem, you can explore dedicated strategies to reduce customer acquisition costs in Google Ads. These platforms offer powerful tools, but they require active management to stay profitable.
Build Your Organic Channels
While paid ads deliver immediate traffic, organic channels like SEO and content marketing are long-term investments that can dramatically lower your blended CAC over time. Sure, creating valuable blog content or optimizing your product pages costs time and resources upfront. But a single piece of content can attract customers for years with no ongoing ad spend.
This strategy is more important than ever. The average cost to acquire a customer in e-commerce is on a steep upward trend. One recent analysis found that brands were losing $29 per new customer, a stunning 222% increase in acquisition cost over eight years. This highlights the urgent need to diversify away from a total reliance on paid ads.
A solid organic strategy acts as a buffer against rising ad costs. Check out our guide on the best e-commerce marketing strategies for more ideas on building a balanced acquisition portfolio.
Lowering your CAC is an ongoing process of testing, learning, and optimizing. By focusing on these high-impact areas, you can turn the insights from your calculator into real, profitable action.
Common Questions About CAC Calculators
Once you've built your customer acquisition cost calculator, a few questions almost always come up. Getting these sorted out early is the difference between having a useful tool and making bad decisions based on flawed data. Let's walk through the most common ones I hear from brands.
How Often Should I Update My CAC Calculation?
For most e-commerce businesses, calculating your CAC monthly is the sweet spot. It's frequent enough to give you a clear picture of how your campaigns are performing without causing you to panic over normal day-to-day sales dips or ad spend spikes. Think of it as your regular strategic check-in.
But what if you're running a massive Black Friday promotion or are in a super high-volume niche? In those cases, switching to a weekly calculation can be a game-changer. It lets you pivot fast—shifting budget from a dud ad set to a clear winner before you’ve wasted too much money.
No matter your regular rhythm, a full quarterly review is non-negotiable. This is where you’ll spot the bigger, more meaningful trends that get lost in the weekly or monthly noise.
What Is a Good LTV to CAC Ratio?
The magic number everyone aims for is a 3:1 LTV:CAC ratio. In plain English, this means for every dollar you spend to get a customer, they spend three dollars with you over their lifetime. A 3:1 ratio gives you enough breathing room to cover your product costs and overhead while still banking a healthy profit.
If your ratio is 1:1, you have a serious problem. You're basically losing money on every sale you make. On the other hand, if you're hitting 4:1 or higher, that’s a fantastic signal that you have room to get much more aggressive with your marketing spend.
Do I Really Need to Include Team Salaries in CAC?
Yes. 100%. If you want a "fully loaded" CAC that tells you the real cost of getting a new customer, you have to include the prorated salaries and commissions for your sales and marketing teams.
Skipping this step will make your CAC look artificially low. That’s a dangerous game. It can trick you into thinking a channel is a goldmine when it's actually a money pit once you factor in the people-power required to keep it running. Don’t fool yourself—include the salaries.
How Do I Calculate CAC for Organic Channels Like SEO?
Organic channels don't have a straightforward ad spend, but they are absolutely not "free." To figure out the CAC for something like SEO, you need to add up all the associated costs for a given period.
This includes:
- Salaries for your in-house SEO or content team.
- Invoices from any freelance writers or SEO consultants.
- Subscription costs for your tools, like Ahrefs or SEMrush.
Once you have that total cost, just divide it by the number of new customers who came through organic search during that same time. You can track this pretty accurately by setting up conversion goals in Google Analytics and looking at your attribution models.
Ready to stop guessing and start making data-driven decisions? The team at Next Point Digital specializes in building profitable acquisition funnels for ecommerce brands. We turn complex data into clear, actionable growth strategies. Get in touch to see how we can lower your CAC and scale your sales.