Data-driven digital marketing is really just the practice of using customer information to sharpen your marketing strategies and create more personal experiences for your audience. Instead of relying on assumptions or what you think might work, this approach uses hard numbers and behavioral insights to make smarter decisions about everything from ad spend to website design.
It’s about replacing guesswork with something a lot closer to certainty.
Why Data-Driven Marketing Is Essential for Ecommerce
Think of it this way: an old-school ship captain might navigate using intuition and the stars. It works, sometimes, but it’s incredibly risky. A modern, data-driven captain, on the other hand, uses precise instruments—GPS, sonar, and weather charts—to plot the safest, most efficient course.
For ecommerce brands selling on hyper-competitive platforms like Amazon, Walmart, or their own D2C site, that level of precision isn't a luxury anymore; it's a requirement for survival. Your competition is already using data to decode customer behavior, fine-tune their product listings, and nail their ad campaigns. Operating without it is like sailing blindfolded into a storm.
Transforming Numbers Into Actionable Insights
At its core, data-driven marketing is about translating raw numbers into compelling customer stories. Every click, purchase, and review is a piece of that story, telling you something valuable about your audience. When you collect and analyze this information, you can finally move from being reactive to proactive.
This strategic shift lets you:
- Anticipate Customer Needs: Predict what products someone might be interested in next based on their browsing history.
- Optimize Ad Spend: Put your budget where it actually works—on the channels and campaigns delivering the highest return.
- Enhance Customer Experience: Personalize website content, product recommendations, and emails to make each person feel understood.
A data-driven approach transforms marketing from a cost center into a predictable, scalable growth engine. It’s the foundation for building a system that learns and gets smarter with every single customer interaction.
The power of this approach is even more apparent when you look at how businesses are Harnessing AI in Ecommerce for Retail Success. This evolution is mirrored in the market’s explosive growth, with the digital marketing industry projected to hit $807 billion by 2026, a massive jump from $531 billion in 2022. This data-fueled dominance isn't slowing down.
To see how these concepts work in the real world, check out our guide on specific data-driven marketing strategies. This article will give you the foundational knowledge you need to start building your own data-centric marketing engine.
Building Your Ecommerce Data Stack

To really nail data driven digital marketing, you need the right tools in your workshop. Think of your data stack like a well-organized kitchen for a master chef. Each piece has a job, working together to turn raw ingredients—your data—into something amazing.
Without this setup, you’re just staring at a chaotic pile of information, and it's impossible to see the big picture. A good data stack makes sure everything flows smoothly from where it’s collected all the way to your decision-making dashboard.
The Three Essential Layers of a Data Stack
Your data infrastructure doesn't need to be complicated or break the bank to be effective. It just needs three core layers that work together. Each one builds on the last, turning raw numbers into clear, actionable insights your marketing team can actually use.
- Data Sources (The Ingredients): This is where all your customer and performance data comes from. It's the raw material for every insight you'll eventually uncover.
- Data Warehouse (The Central Hub): Think of this as the pantry where you clean, organize, and store all your ingredients. It pulls everything together into one reliable source of truth.
- Analysis and Visualization Tools (The Chef's Tools): These are the knives, mixers, and ovens you use to turn organized data into your final reports and dashboards.
This layered approach is key to building a system that can grow with you. As your business expands, you can swap out or upgrade parts of each layer without having to tear down the whole kitchen and start from scratch.
Layer 1 Sourcing Your Raw Data
The foundation of any data-driven strategy is the quality and variety of its data sources. For an ecommerce brand, that means pulling information from every single touchpoint in the customer journey. You need a complete, 360-degree view.
Key data sources include:
- Marketplace Reports: This is all the detailed info from platforms like Amazon Seller Central or Walmart Seller Center. These reports give you the hard numbers on sales, ad performance (ACoS, TACOS), inventory levels, and even customer reviews. For a deeper dive, our guide on how to analyze your Amazon sales data has some practical tips.
- Web Analytics: Tools like Google Analytics 4 are a must-have for D2C sites. They track how people behave, where they come from, and what paths they take to convert, showing you exactly how shoppers interact with your brand.
- CRM Systems: Your Customer Relationship Management (CRM) platform is a goldmine. It holds vital info on customer history, repeat purchases, lifetime value (CLV), and how they prefer to be contacted. It’s what connects your marketing efforts to long-term customer loyalty.
- Ad Platforms: Data from Google Ads, Meta Ads, and TikTok Ads tells you how your campaigns are performing, who you're reaching, and which creative is actually working outside of the marketplaces.
By connecting these sources, you can start to answer the really important questions. For example, you can see how a customer who first found your brand on a Google Ad later bought your product on Amazon, and then signed up for your D2C email list.
This unified view is where the magic of data driven digital marketing really happens. It lets you move beyond thinking about individual channels and start understanding the entire, often messy, path to purchase. From there, you can build a marketing operation that's not just busy, but genuinely profitable.
Core Frameworks for Data-Driven Decisions
Having access to mountains of data is a good start, but it's not the end goal. Raw data on its own is like a pile of uncooked ingredients—full of potential but useless without a recipe. To turn numbers into real-world strategy, you need proven frameworks to give you structure, clarity, and a clear path to repeatable success.
These frameworks are the core recipes of data-driven digital marketing. They provide the right methods for gathering information, understanding campaign impact, testing new ideas, and delivering the personalized experiences that today's customers demand. Without them, you're just collecting data; with them, you're making intelligent decisions.
Strategic Data Collection and Sourcing
The first framework isn’t about hoarding every piece of data you can find. It’s about being strategic and sourcing the right ingredients for your marketing "meal." Think of yourself as a chef selecting only the freshest, most valuable components. The goal is to identify and integrate the key data points that tell a complete story about your customers and your business.
This means pulling specific, high-value information from core platforms:
- Amazon & Walmart Reports: Go beyond simple sales numbers. You need data on Advertising Cost of Sales (ACoS), keyword performance, and customer reviews to really get a feel for the marketplace.
- Google Analytics: Track how users behave on your D2C site. Look at everything from landing page engagement and session duration to conversion paths and cart abandonment rates.
- Ad Platform Metrics: Analyze CTR (Click-Through Rates), CPC (Cost Per Click), and conversion data from Google Ads and Meta Ads to see if your campaigns are actually resonating.
- CRM Insights: Use your customer relationship management system to track repeat purchase rates, customer lifetime value (CLV), and how your customers prefer to be contacted.
Focusing on these key sources gives you a clean, potent dataset ready for analysis. This is the foundation for how to scale an ecommerce business effectively.
The table below breaks down the essential data sources, what you can learn from them, and how to apply those insights directly to your marketing efforts.
Core Data Sources for Ecommerce Brands
| Data Source | Key Metrics & Insights | Primary Application |
|---|---|---|
| Marketplaces (Amazon/eBay) | Sales velocity, ACoS/RoAS, keyword rankings, customer reviews, competitor performance | Optimizing product listings, refining ad spend on marketplaces, managing inventory based on demand trends. |
| Web Analytics (Google Analytics) | Traffic sources, user behavior flow, conversion rates, cart abandonment, session duration | Improving website user experience (UX), identifying drop-off points in the sales funnel, optimizing landing pages. |
| CRM (Klaviyo/HubSpot) | Customer Lifetime Value (CLV), purchase frequency, segmentation data, email engagement | Building targeted email campaigns, creating loyalty programs, personalizing customer communication. |
| Ad Platforms (Google/Meta Ads) | Click-Through Rate (CTR), Cost Per Conversion, audience demographics, creative performance | Allocating ad budget to the best-performing channels, refining audience targeting, A/B testing ad copy and visuals. |
By pulling these sources together, you move from isolated numbers to a cohesive picture of your customer's journey and your business's health.
Attribution Modeling to Measure True ROI
Once you have your data, the next framework helps you figure out what it all means. Attribution modeling is like your marketing game-day replay. It lets you review every single touchpoint in the customer journey and assign proper credit to the channels that led to a sale. Was it that first social media ad they saw, the follow-up email, or the final branded search that finally sealed the deal?
Attribution moves you from guessing which channels work to knowing precisely how they contribute to your revenue. It's the difference between saying "we think our ads are working" and "our YouTube ads assisted in a 32% growth in conversions."
Common models include:
- Last-Click Attribution: Gives 100% of the credit to the final touchpoint before a sale. It's simple, but it completely ignores the channels that built initial awareness.
- First-Click Attribution: Assigns all the credit to the very first interaction a customer had with your brand. This is great for figuring out what drives initial discovery.
- Linear Attribution: Spreads credit evenly across all touchpoints. It’s a fair approach that acknowledges every interaction plays a role.
- Data-Driven Attribution: Uses machine learning to analyze conversion paths and assign credit based on actual contribution. This is the most accurate but also the most complex model to set up.
Choosing the right model helps you allocate your budget with confidence, ensuring you invest more in the channels that deliver real, measurable results.
A/B Testing and Experimentation
The third framework turns your marketing department into a science lab. A/B testing, or split testing, is a simple but powerful way to compare two versions of a marketing asset—like an ad creative, a product title, or a landing page—to see which one performs better. You're letting your audience's actions tell you what they prefer.
This experimentation mindset is at the heart of data-driven digital marketing. It removes ego and guesswork from your decisions. For instance, you could test:
- Two different headlines for an Amazon product listing.
- A green "Buy Now" button versus a blue one on your D2C site.
- A video ad against a static image ad on Facebook.
By running these controlled experiments and measuring the results, you can make small, incremental improvements that compound into significant gains in conversion rates and ROAS over time.
Personalization for Customer Centricity
Finally, the personalization framework acts as your brand’s virtual personal shopper. It uses all the data you’ve collected to create tailored experiences that make each customer feel seen and understood. Instead of shouting one generic message to everyone, you can whisper the right message to the right person at the right time.
This is where all the other frameworks come together. You can use transaction data to recommend complementary products, or use browsing history to send a perfectly timed reminder about an abandoned cart. The proof is in the numbers: global ad spend is projected to blow past $740 billion by 2026 as brands lean on analytics for this exact kind of optimization.
One D2C brand integrated YouTube into different stages of their funnel and saw a 32% growth in assisted conversions, showing just how powerful a connected, data-informed strategy can be. You can discover more insights about digital marketing growth projections on DigitalTrainee.com.
The Essential Metrics and KPIs That Actually Matter
In data-driven marketing, it’s easy to get lost in a sea of numbers. But not all metrics are created equal. Chasing "vanity metrics" like social media likes might feel good, but they don't directly translate to a healthier bottom line.
The key is to focus on Key Performance Indicators (KPIs) that tell a clear story about your business’s health at each stage of the customer journey. Think of your marketing funnel as a series of checkpoints. At each point, a different set of metrics reveals whether your strategy is working or if there's a leak that needs fixing. By measuring what truly moves the needle, you can make smarter decisions for your Amazon, Walmart, or D2C business.
Awareness Stage Metrics
This is the top of your funnel, where the goal is simply to get your brand and products in front of potential customers. You're not measuring sales yet; you're measuring pure reach and visibility.
- Impressions: This is the total number of times your ad or product listing was displayed. On Amazon, this shows how often your sponsored product ad popped up in search results. It’s a foundational metric for gauging whether you're even in the game.
- Share of Voice (SOV): This KPI measures your brand's visibility against your competitors for specific keywords. A higher SOV means you’re capturing more of the digital shelf space, making your brand impossible to ignore during that initial discovery phase.
Consideration Stage Metrics
Once a potential customer is aware of you, the next step is to grab their interest and get them to learn more. These metrics show how effectively you're turning eyeballs into engagement.
The goal here is to bridge the gap between seeing and wanting. A strong performance in the consideration stage means your product listings and ad creative are compelling enough to earn the click.
- Click-Through Rate (CTR): This is the percentage of people who saw your ad or listing (impressions) and then actually clicked on it. A low CTR is a huge red flag—it could mean your main image isn't appealing, your title isn't optimized, or your price just isn't competitive.
- Product Detail Page Views: For both D2C sites and marketplaces, this metric tracks how many people are landing on your product pages. It's a direct measure of interest and the first real step toward a potential purchase.
Conversion Stage Metrics
This is where your efforts finally turn into revenue. Conversion metrics are the ultimate proof that your marketing strategy is working, telling you how efficiently you're turning interested shoppers into paying customers.
Key conversion KPIs include:
- Conversion Rate (CVR): The percentage of visitors who complete a desired action, which is usually making a purchase. A high conversion rate means your product page is persuasive and your checkout process is smooth.
- Customer Acquisition Cost (CAC): This is the total cost of your marketing and sales efforts divided by the number of new customers you brought in. A low CAC is absolutely essential for profitable growth.
- Return on Ad Spend (ROAS): This measures the gross revenue generated for every single dollar spent on advertising. It directly answers the question: "Is my ad budget actually making me money?"
Retention Stage Metrics
Getting a new customer is just the beginning. The most profitable ecommerce brands are masters at turning one-time buyers into loyal, repeat customers. Retention metrics reveal the long-term health and sustainability of your business.
Artificial intelligence has become the backbone of this process, with 68% of marketing executives reporting a positive ROI on their AI investments. It powers the kind of personalization needed for effective retention. In fact, data analysis is now considered an essential skill for 25% of digital marketers, enabling precise targeting in real-time.
- Customer Lifetime Value (CLV): This predicts the total revenue your business can expect from a single customer over the entire course of your relationship. A high CLV is a clear sign of strong brand loyalty.
- Repeat Purchase Rate: This is the percentage of customers who have come back to make more than one purchase. It's a powerful indicator of customer satisfaction and product quality.
For a deeper dive into optimizing your online store, mastering ecommerce performance metrics is essential reading. By tracking these funnel-specific KPIs, you can move beyond guesswork and build a growth strategy that’s truly driven by data.
Implementing Your Data-Driven Marketing Roadmap
All the theory in the world doesn't mean a thing until you put it into action. That's where the real growth starts. A solid data-driven digital marketing strategy isn't something you can flip a switch on overnight; it's built in thoughtful, manageable phases.
This roadmap is designed to give you a clear, step-by-step path from a basic setup to sophisticated optimization. By starting small, you can build confidence with early wins and create momentum that lasts. Each phase builds directly on the one before it, making sure your data capabilities grow in a way that’s logical and actually makes a difference.
Phase 1: The Foundational Audit
Before you build anything new, you have to know what you’re working with. This first phase is all about discovery and setup. Think of it like surveying the land before you pour the foundation for a new house—you need to know the terrain inside and out.
The main goal here is a full-on data audit. That means identifying every single one of your current data sources, from Amazon Seller Central and Google Analytics to your CRM and ad platforms. You need to get a real sense of the quality of this information and how easily you can get to it.
Once you have a clear inventory, the next step is getting your essential tracking in place. This is about making sure your analytics tools are set up correctly to capture the KPIs that actually matter to your business.
- Action Step 1: Map out every data source you have, covering both your D2C site and any marketplaces you sell on.
- Action Step 2: Double-check that all your tracking codes, like the Google Analytics tag or Meta Pixel, are installed right and firing correctly on all the important pages.
- Action Step 3: Pin down your core KPIs for each stage of the funnel—Awareness, Conversion, and Retention—and make sure you can actually measure them.
This graphic shows exactly how those key performance indicators line up with the customer journey, from grabbing their attention to making the sale and keeping them around.
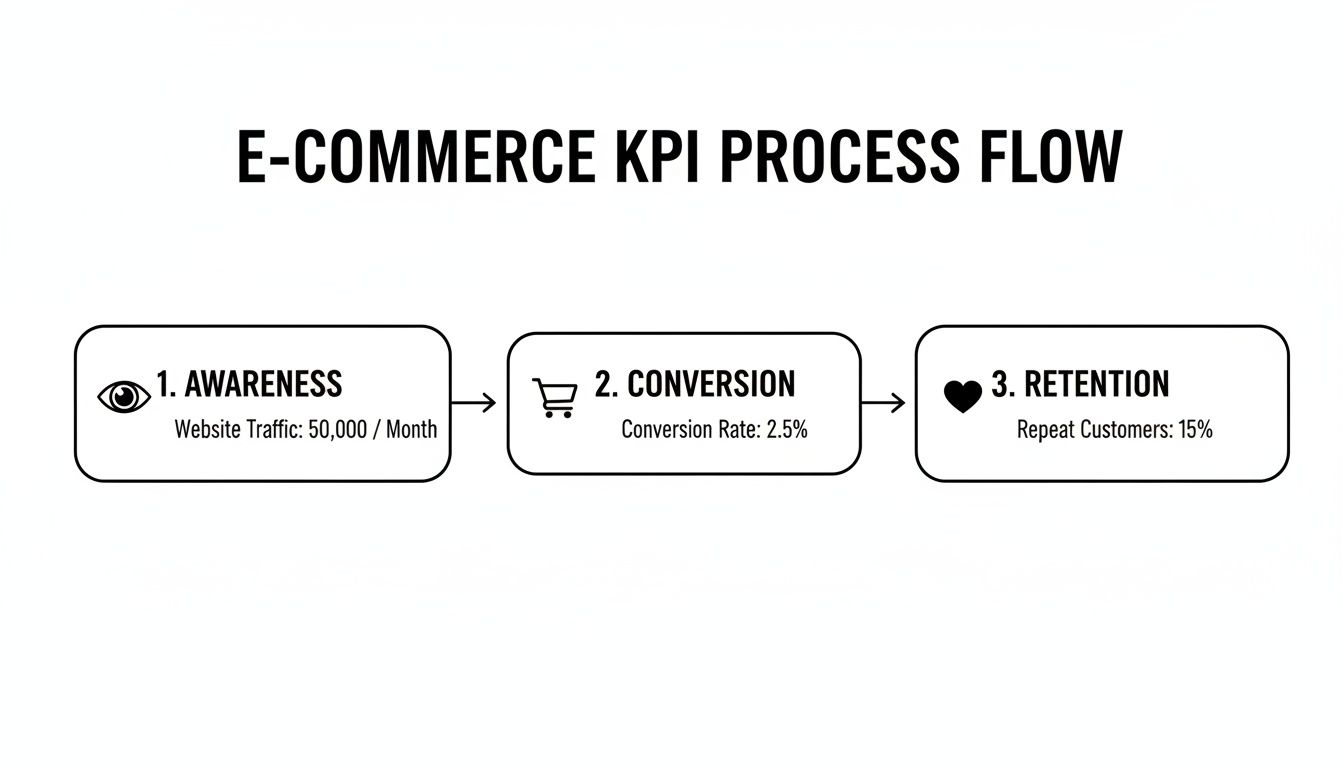
It’s a simple but powerful reminder that winning at marketing means optimizing the entire funnel, not just obsessing over the final sale.
Phase 2: Integration for a Unified View
Okay, with your foundation solid, Phase 2 is all about connecting the dots. Data that’s stuck in different silos is almost useless. The real power of data-driven digital marketing is unlocked when you bring all your platforms together to create a single, unified view of your customer.
Think of it like getting all your ingredients into one central kitchen. When you connect your marketplace data with your web analytics and CRM, you can finally see the entire customer journey. You'll be able to track how a customer who first clicked a Facebook ad eventually bought something from your Amazon store.
Creating this unified data stream is a total game-changer. It moves you from making small, channel-specific tweaks to orchestrating a cohesive, cross-platform strategy built on a deep understanding of how your customers really behave.
The goal here is to pipe data from all those separate sources into a central hub, whether that's a data warehouse or a powerful analytics platform. This gives you a single source of truth for every marketing decision you make from here on out.
Phase 3: Optimization Through Experimentation
Now for the fun part. Your data is clean, tracked, and all in one place, so it's time to put it to work. Phase 3 is where you shift from just analyzing to taking action through structured experiments. This is when you'll launch your first A/B tests to fine-tune your campaigns based on real-world insights, not just gut feelings.
You don't have to get complicated. Start with simple tests that can have a big impact. For example:
- Test Ad Creative: Run two different ad images on a social media campaign to see which one gets a better click-through rate.
- Optimize Product Titles: A/B test a keyword-heavy title against a benefit-driven one on a single product listing.
- Refine Landing Pages: Try changing the call-to-action button color on your D2C product page to see if it lifts sales.
These early tests will help your team build confidence in making decisions based on data. If you need more ideas on where to start, our guide has a bunch of powerful conversion rate optimization tips.
Phase 4: Scaling with Advanced Tactics
The final phase is all about scaling what works. You’ve now got a proven system for collecting, integrating, and testing data, which means you're ready to explore more advanced strategies. This is where you can start to build a serious competitive edge.
This could mean bringing in predictive analytics to forecast customer behavior or future sales trends. You could also develop more complex personalization campaigns that tailor website content or email offers to individual users based on their past actions. At this stage, your marketing stops being just reactive and becomes proactive and predictive.
Designing Dashboards That Drive Action
Raw data is just noise until you give it a clear voice. A powerful dashboard doesn't just show you numbers; it tells a story about your business. It turns a mess of metrics into simple, visual narratives that get people talking, guide your next move, and lead directly to smarter marketing decisions.
An effective dashboard should give you immediate answers to your biggest questions without forcing you to dig through spreadsheets. It should spotlight what’s working, flag what isn't, and uncover opportunities you might have otherwise missed. The goal here is to create reports that demand action, not just a passing glance.
Three Essential Ecommerce Dashboard Templates
To build a reporting system that actually works, you need to create specific views for different parts of your business. A one-size-fits-all dashboard usually fails because it doesn't provide the focused insights needed for a true data driven digital marketing approach. Instead, you'll want to tailor your reports to the unique goals of each channel.
Here are three templates every ecommerce leader should have:
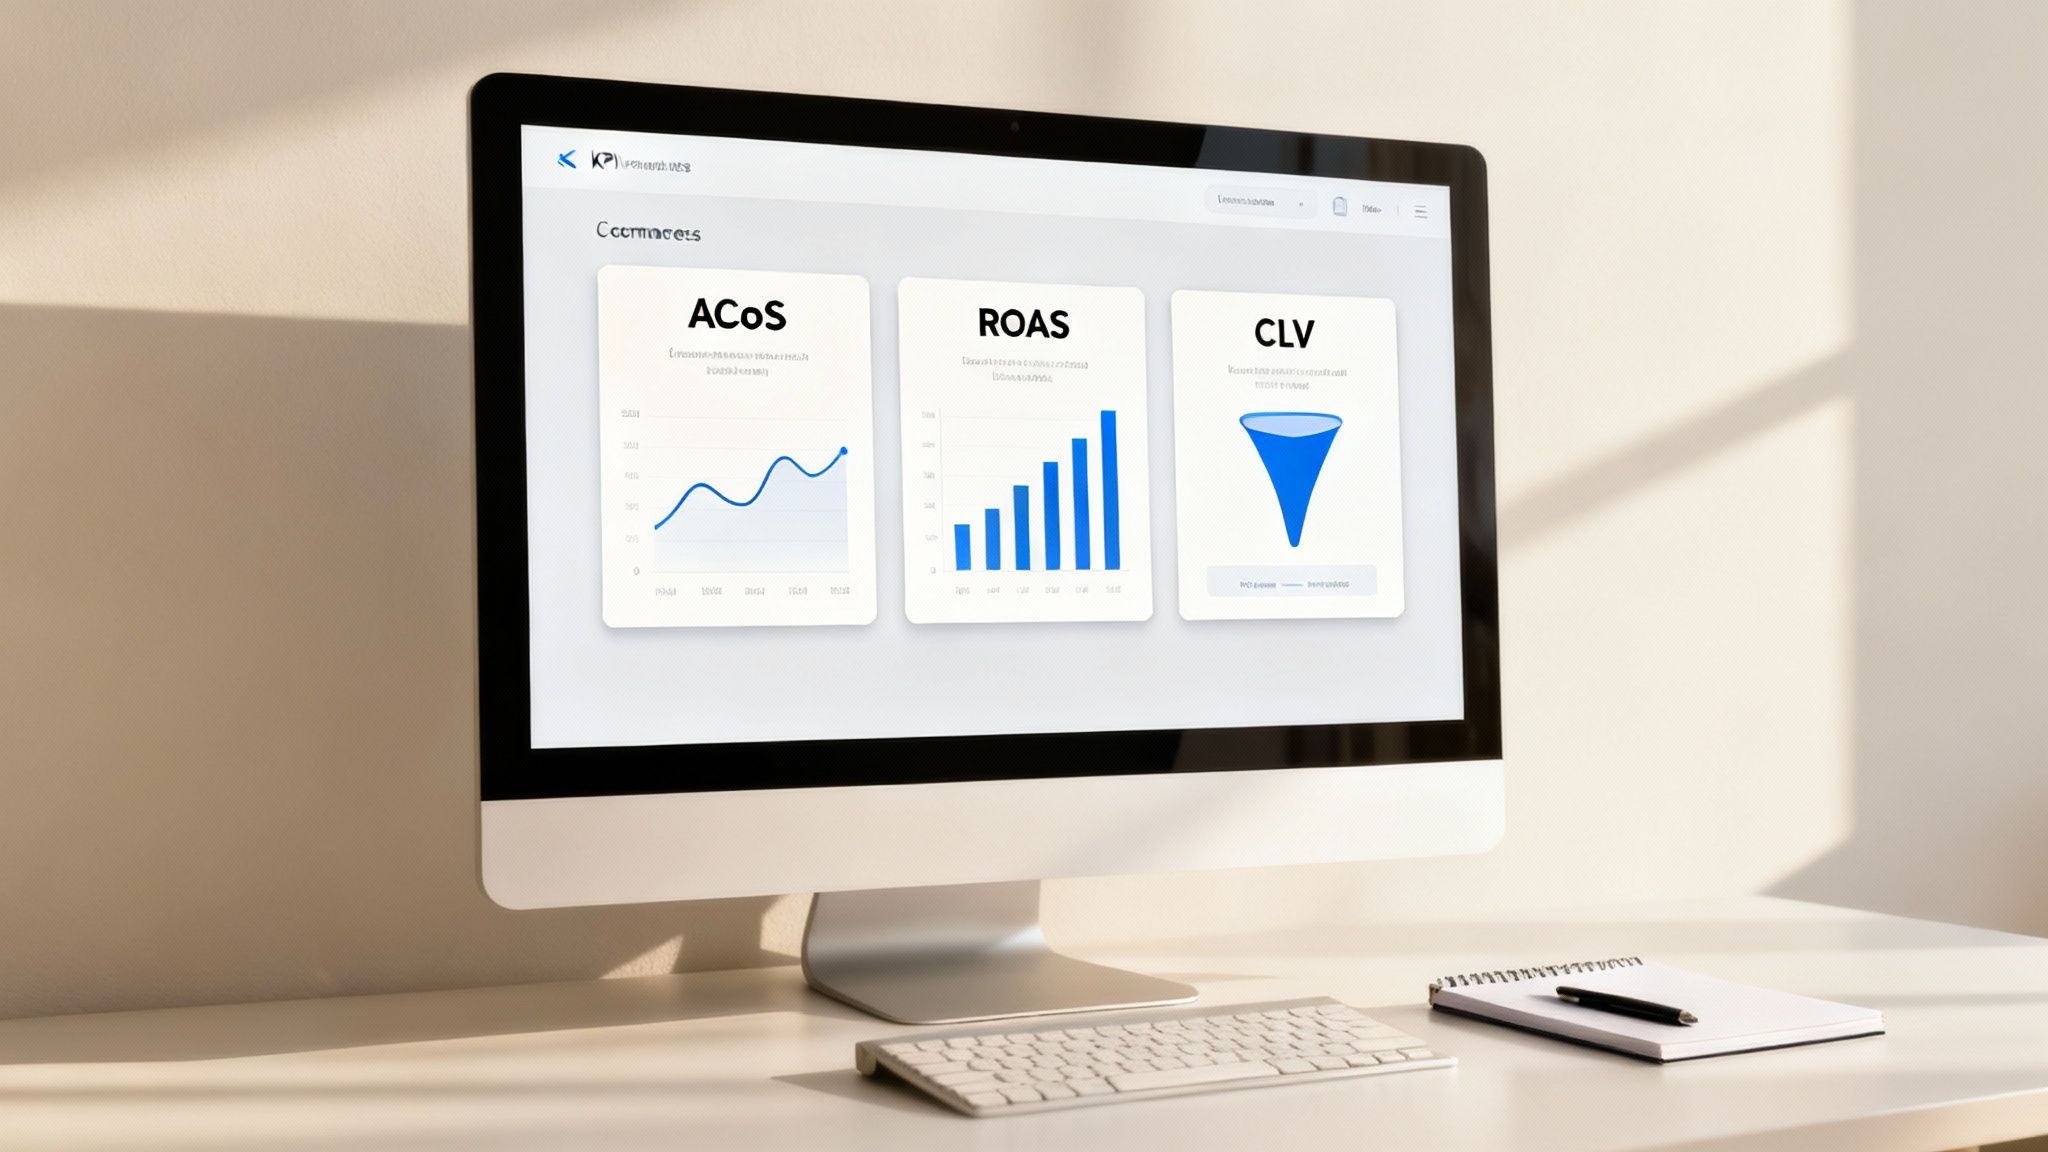
- The Marketplace Performance Dashboard: This is your command center for platforms like Amazon and Walmart. It needs to put critical marketplace metrics front and center, tracking Total Advertising Cost of Sales (TACOS) and Advertising Cost of Sales (ACoS) to keep an eye on profitability. It should also monitor keyword rankings and ad performance so your products stay visible.
- The D2C Growth Dashboard: Your own direct-to-consumer site requires a completely different lens. This dashboard focuses on the entire customer journey, from their first visit to the final purchase. Key metrics here include website conversion rates, the all-important CLV to CAC ratio (Customer Lifetime Value vs. Customer Acquisition Cost), and cart abandonment rates. This view helps you find and fix the leaks in your sales funnel.
- The Full-Funnel Advertising Dashboard: This report pulls together data from all your ad channels—Google, Meta, marketplace ads, you name it—into a single source of truth. By blending this channel-specific data, you can finally see the complete customer path to purchase, measure attribution correctly, and make smarter decisions on where to put your budget.
A well-designed dashboard turns data into a shared language for your entire team. It aligns everyone around the same goals and KPIs, making it easier to collaborate on growth initiatives and measure the impact of your efforts.
Building these views is a huge step in putting your data strategy to work. But let's be honest, creating truly insightful reports often requires specialized expertise. For brands looking to get there faster, exploring options for customized reporting can provide the clarity needed to scale. When you visualize the right data in the right way, you empower your team to stop guessing and start making confident, data-backed decisions that drive real results.
Frequently Asked Questions
Jumping into a data-driven approach can bring up a lot of questions. It’s completely normal. Below are some clear, actionable answers to the most common hurdles ecommerce leaders face.
Think of this as a quick-start guide to build on the concepts we’ve covered and give you the confidence to move forward. Each answer tackles a real-world problem, from budgeting for tools to figuring out where to even start when you feel like you're drowning in numbers.
How Can I Start If I Have a Small Budget?
You absolutely don’t need an enterprise-level budget to get started with data-driven digital marketing. The trick is to begin with powerful, free tools and laser-focus on improving just one specific area.
Start with what you already have access to:
- Google Analytics 4: It's completely free and gives you an incredible window into your D2C website traffic, user behavior, and conversion paths.
- Marketplace Analytics: Both Amazon Seller Central and Walmart Seller Center provide detailed, built-in reports on sales, advertising performance, and customer engagement at no extra cost.
- Spreadsheet Software: Tools like Google Sheets are perfect for manually pulling data from different sources to create simple dashboards that track your most important KPIs.
Master these foundational tools first. They provide more than enough data to begin making smarter, more informed decisions about your marketing efforts.
Where Should I Begin If I Feel Overwhelmed by Data?
Feeling overwhelmed is a common first step, so don't worry. The solution is to narrow your focus and start by asking a single, high-impact question you want to answer. Don't try to analyze everything at once.
Instead of asking, "How can I improve my marketing?" ask something more specific, like, "Which of my top three traffic sources has the highest conversion rate on my website?"
This simple shift turns a huge, undefined problem into a manageable task.
Answer that one question using your data, make one small change based on what you find, and then measure the result. This creates a small, repeatable loop of insight, action, and measurement that builds momentum and confidence. It’s all about taking small, deliberate steps, not giant, intimidating leaps.
How Do I Measure Something Qualitative Like Brand Awareness?
Measuring something as abstract as brand awareness can feel tricky, but you can absolutely track it using specific data points that show your brand's visibility and recognition over time.
Focus on these key metrics:
- Direct Traffic: An increase in users typing your URL directly into their browser is a strong signal that more people know your brand by name.
- Branded Search Volume: Use tools like Google Trends or your ad platform's keyword planner to see how many people are searching for your specific brand name or products.
- Share of Voice (SOV): Track how often your brand appears for top keywords on marketplaces compared to your competitors. A rising SOV means you're capturing more attention.
By tracking these trends, you can put real numbers to your brand’s presence in the market.
Ready to stop guessing and start growing? The team at Next Point Digital specializes in turning complex data into clear, profitable action. We build the strategies and systems that allow ecommerce brands to scale with confidence.