Trying to navigate digital advertising without the right metrics is like sailing the open ocean without a compass. You’re definitely moving, but you have no idea if you’re heading toward treasure or straight into a storm. These digital advertising performance metrics aren't just numbers on a spreadsheet; they're the language of growth, turning clicks into customers and ad spend into predictable revenue.
Why Performance Metrics Are Your Brand's Compass

In the crowded world of ecommerce, understanding your key numbers is what separates wasting your budget from achieving profitable scale. Just launching a campaign and hoping for the best is a proven recipe for failure. Performance metrics give you the feedback loop you need to spot problems, find opportunities, and make smart decisions that actually move the needle.
The digital ad space is only getting tougher. By 2025, it’s expected to pull in 75.2% of all global ad spending, hitting an incredible $777 billion. For brands selling on platforms like Amazon, eBay, and Walmart, this boom creates massive opportunities to scale with targeted ads—but only if performance is tracked down to the dollar.
The Foundation of Strategic Growth
Without a clear way to measure what’s happening, you’re left guessing on the most basic questions. Are my ads even reaching the right people? Is the creative good enough to get a click? And are those clicks actually turning into sales? Each metric tells a part of the story, helping you connect the dots between your ad efforts and your bottom line.
This guide will break down the core metric categories you need to know:
- Awareness Metrics: These tell you how many people are seeing your ads and how visible your brand is.
- Engagement Metrics: These show you how users are interacting with your ads, from clicks to shares.
- Conversion Metrics: These are the bottom-line numbers that track sales, leads, and—most importantly—profitability.
By focusing on the right digital advertising performance metrics, you turn raw data into actionable intelligence. It’s the difference between guessing what works and knowing exactly what drives results and how to do it again.
Getting a handle on these numbers is the first step toward building effective, data-driven marketing strategies that ensure every dollar you spend is an investment in real, measurable growth.
Decoding Your Campaign's First Signals

Before you can ever measure profit, you have to measure attention. Foundational digital advertising performance metrics are the early warning signals for your campaigns. They tell you if you’re capturing interest long before a sale ever happens.
Think of it like setting up a physical storefront. First, you need to know how many people walk by (Impressions). Then, you need to know how many actually stop to look in the window (Clicks). Only then can you start worrying about who comes inside to buy something. These initial numbers are all about reach and relevance.
The Billboard vs. The Toll Booth: Two Ways to Pay for Traffic
Two of the most common metrics—Cost Per Mille (CPM) and Cost Per Click (CPC)—represent entirely different ways of paying to get your message out there. Getting a handle on them is critical for managing your ad budget effectively.
CPM, which stands for Cost Per Mille or Cost Per Thousand Impressions, is like paying for a billboard on a busy digital highway. You pay a set price for every 1,000 times your ad gets shown, whether anyone clicks on it or not. This model is perfect for brand awareness campaigns where the main goal is simply to be seen.
On the other hand, Cost Per Click (CPC) is like paying a toll only when a car pulls off that highway to visit your store. You’re only charged when someone actually clicks your ad. This means you’re paying for an active expression of interest, not just a passing glance. For performance-focused campaigns, especially in PPC advertising, CPC is a much more direct measure of engagement. If you want to see this model in action, our guide on what is PPC advertising on Amazon breaks it down further.
Is Your Ad Creative Actually Working?
While CPM and CPC tell you about cost, Click-Through Rate (CTR) tells you about the quality and relevance of your ad. It’s the single best early indicator of whether your message is resonating with your target audience.
CTR is calculated by dividing your total clicks by your total impressions. A high CTR suggests your ad copy, visuals, and targeting are compelling enough to make people act. A low CTR, however, is a red flag that something’s off—your ad might be boring, irrelevant, or shown to the wrong people.
Formula for CTR: (Total Clicks / Total Impressions) x 100 = Click-Through Rate (%)
For example, if your ad was shown 10,000 times and got 200 clicks, your CTR would be 2%. This simple percentage is a powerful diagnostic tool for your creative strategy.
It's also important to remember that different ad formats have different benchmarks. Data shows Google search ads, which capture a user's direct intent, average a 3.17% CTR. Meanwhile, display ads, which are more passive, average just 0.46%. Knowing these differences helps you set realistic goals for your campaigns.
Top-of-Funnel Metrics At a Glance
To make sense of these foundational signals, it helps to see them side-by-side. Each metric provides a unique piece of the puzzle, helping you understand your campaign's health before you even get to conversions.
Here’s a quick-reference table to clarify these core concepts:
| Metric | Formula | What It Measures | Good For |
|---|---|---|---|
| Impressions | N/A (A raw count) | The total number of times your ad was displayed on a screen. | Gauging brand visibility and the overall reach of your campaign. |
| CPM | (Total Cost / Total Impressions) x 1000 | The cost to achieve 1,000 ad impressions. | Budgeting for awareness campaigns where reach is the primary goal. |
| CPC | Total Cost / Total Clicks | The average cost you pay for a single click on your ad. | Measuring the cost-efficiency of campaigns designed to drive traffic. |
| CTR | (Total Clicks / Total Impressions) x 100 | The percentage of people who saw your ad and then clicked it. | Evaluating the relevance and effectiveness of your ad creative and targeting. |
Mastering these early signals is the first step toward building a truly data-driven advertising strategy. They give you the insights needed to optimize your creative, fine-tune your targeting, and control your costs before moving down the funnel to the metrics that directly impact your bottom line.
From Clicks to Conversions: The Metrics That Actually Matter
A high Click-Through Rate feels great, but it doesn't pay the bills. Clicks are just a sign of interest; conversions are what generate revenue. This is where we shift our focus from attention to action, digging into the digital advertising performance metrics that connect your ad spend directly to your bottom line.
These metrics—Conversion Rate (CVR), Cost Per Acquisition (CPA), and Return on Ad Spend (ROAS)—are the language of business growth. They move beyond vanity and measure the real financial impact of your campaigns. They don't just tell you who clicked; they tell you who bought.
Measuring the Moment of Action: Conversion Rate
The most fundamental bottom-of-funnel metric is the Conversion Rate (CVR). It measures the percentage of users who clicked your ad and then completed a specific desired action—like making a purchase, signing up for a newsletter, or filling out a contact form.
Formula for CVR: (Total Conversions / Total Clicks) x 100 = Conversion Rate (%)
Think of CVR as the efficiency of your landing page. If 1,000 people click your ad but only 20 buy your product, your CVR is 2%. This metric instantly tells you how well you turn traffic into customers. A low CVR, even with a high CTR, often signals a disconnect between what your ad promises and what your website delivers. Improving this single metric is often the fastest path to profitability, which is why brands invest heavily in conversion rate optimization best practices to make every click count.
Recent Google Ads benchmarks for 2025 show a strong PPC environment where the average CVR is 7.52% across industries, with 65% of sectors seeing improved conversion rates despite rising costs. You can learn more about these performance improvements in the full 2025 benchmarks report.
Counting the Cost of a Customer: Cost Per Acquisition
While CVR measures efficiency, Cost Per Acquisition (CPA)—sometimes called Cost Per Action—measures cost-effectiveness. It tells you exactly how much you spent on advertising to get a single new customer.
Formula for CPA: Total Ad Spend / Total Conversions = Cost Per Acquisition
For example, if you spent $500 on a Google Ads campaign that resulted in 25 sales, your CPA would be $20. This number is absolutely critical for ecommerce brands. Knowing your CPA allows you to make informed decisions about your budget and profitability. If your product's profit margin is $30, a $20 CPA means you’re making money. If your margin is only $15, you’re losing money on every sale and need to fix your campaign immediately.
CPA is the ultimate reality check for your ad spend. It forces you to ask the most important question: is this campaign actually profitable?
The Ultimate Measure of Profitability: Return on Ad Spend
Finally, we get to the king of conversion metrics: Return on Ad Spend (ROAS). While CPA focuses on cost, ROAS focuses on revenue. It measures the total revenue generated for every single dollar spent on advertising.
Formula for ROAS: Total Revenue from Ads / Total Ad Spend = Return on Ad Spend
ROAS is usually shown as a ratio, like 4:1, or a percentage, like 400%. If you spent $1,000 on ads and generated $4,000 in revenue, your ROAS is 4:1. This means for every dollar you put in, you got four dollars back.
ROAS is the lifeblood for marketplace sellers, especially on platforms like Amazon. Because marketplaces handle fulfillment and have other fees, knowing your gross return is essential for managing profitability. A brand might accept a lower ROAS on a new product launch to gain market share, while aiming for a much higher ROAS on established bestsellers. To truly understand your campaign's impact, it's vital to know how to analyze YouTube Shorts performance with key metrics and benchmarks, as different platforms require different success criteria.
Ultimately, these three conversion metrics work together to paint a complete picture of your campaign’s financial health, helping you make decisions that don't just drive clicks, but build a sustainable, profitable business.
Advanced Metrics for Long-Term Brand Growth
Winning a single campaign feels great, but building a sustainable business is the real prize. While immediate returns like ROAS are vital, the most strategic brands look beyond the initial sale. They focus on digital advertising performance metrics that signal long-term health and create a real competitive edge.
This is where we shift from measuring transactions to measuring relationships. Metrics like Customer Lifetime Value (LTV) and Customer Acquisition Cost (CAC) change the conversation from, "How much did this campaign make?" to, "How valuable is the customer this campaign brought us?"
Getting this right is what separates flash-in-the-pan advertisers from enduring brand builders.
Understanding Customer Lifetime Value
Customer Lifetime Value (LTV), sometimes called CLV, is a forecast of the total revenue you can expect from a single customer over the entire time they do business with you. It’s not just about their first purchase; it’s about every single purchase they will ever make.
Think about a subscription box service. A customer’s first order might only be $30. But if they stick around for an average of 12 months, their LTV is actually $360. That long-term perspective completely changes how you should be thinking about your ad spend.
This diagram shows how users move from an initial click to generating real revenue.
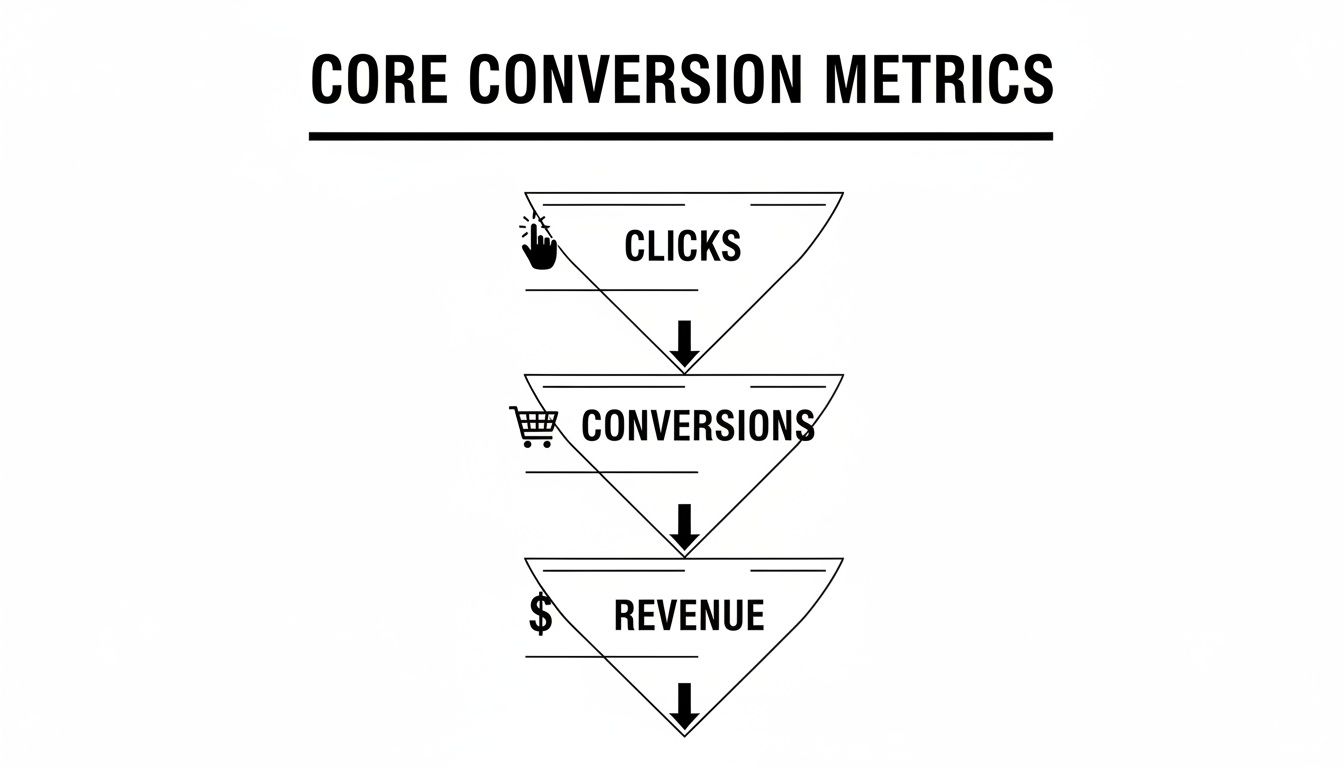
Every stage is a potential drop-off point, which is exactly why you need to maximize the value of every customer who makes it through the funnel.
The LTV to CAC Ratio: The Ultimate Health Check
Knowing a customer's lifetime value is powerful, but it becomes truly actionable when you compare it to what you spent to get them. This brings us to the single most important metric for sustainable growth: the LTV:CAC ratio.
Customer Acquisition Cost (CAC) is the total sales and marketing cost needed to land one new customer. The LTV to CAC ratio tells you how much value you’re creating versus how much you’re spending to get it.
A healthy LTV:CAC ratio is generally considered 3:1 or higher. This means for every dollar you spend acquiring a customer, you can expect to get three dollars back in lifetime value.
Let's go back to our subscription box example:
- LTV: $360
- CAC: Let's say you spent $90 on ads to acquire that customer.
- LTV:CAC Ratio: $360 / $90 = 4:1
A 4:1 ratio is fantastic. It means you can confidently spend $90 upfront—three times the initial order value—because you know the long-term payoff makes it a winning bet. A ratio below 1:1 means you're literally paying to lose money on every new customer.
Maximizing Every Conversion with Average Order Value
Another key lever for improving profitability is Average Order Value (AOV). This metric tracks the average amount a customer spends each time they check out. Pushing your AOV higher is one of the most efficient ways to boost revenue without touching your ad spend.
You can increase AOV with a few proven tactics:
- Cross-selling: Suggesting related items (“Customers who bought this also bought…”).
- Upselling: Offering a bigger or better version of the product.
- Bundling: Grouping complementary items together, usually with a small discount.
- Free Shipping Thresholds: Encouraging shoppers to add one more item to their cart to qualify.
For content creators, understanding the financial performance of their content is crucial, with specialized tools providing insights like AI revenue analytics for YouTube and TikTok creators. By focusing on metrics like AOV and LTV, you stop chasing clicks and start engineering a more profitable, resilient business.
Building a Dashboard That Tells a Story

A spreadsheet packed with numbers isn't a strategy; it's just noise. If you want your digital advertising performance metrics to be genuinely useful, you have to organize them into a dashboard that does more than just report data—it needs to tell a clear and compelling story about your business.
Think of your dashboard like the cockpit of an airplane. A pilot doesn't stare at every single mechanical reading at once. They focus on a few critical instruments—altitude, speed, and direction—that tell them if they're on course. Your dashboard should do the same for your marketing.
The whole point is to move from simply collecting data to generating real insights you can act on. A well-built dashboard turns raw numbers from tools like Google Analytics or the Amazon Advertising console into a strategic guide, showing you what’s working, what isn't, and where your next big opportunity is hiding.
Start With Your Business Goals, Not Metrics
This is the most common mistake marketers make: building a dashboard around the metrics they can track instead of the ones they should track. The first step is to forget the data for a minute and define what you’re actually trying to achieve.
Your dashboard's entire structure should be a direct reflection of your campaign's main objective.
- Goal Brand Awareness: Your dashboard needs to highlight metrics like Impressions, Reach, and CPM. The story here is all about visibility and how efficiently you're getting your brand in front of new eyeballs.
- Goal Lead Generation: Here, the focus shifts to Conversion Rate (for lead forms), Cost Per Lead (CPL), and Click-Through Rate (CTR). This dashboard tells you how effectively you turn ad clicks into potential customers.
- Goal Ecommerce Sales: For ecommerce, the heroes of your story are ROAS, CPA, and Revenue. Every other metric is just a supporting character that helps explain why those critical numbers are going up or down.
When you align your KPIs with your goals, your dashboard instantly becomes a decision-making tool. You can see at a glance if your campaigns are truly contributing to what matters most.
The Art of Visual Storytelling
How you present your data is just as important as the data itself. A cluttered, confusing dashboard will be ignored. But a clean, logical one invites exploration and leads to smarter decisions. The key is to create a visual hierarchy that guides the viewer's eye.
Place your most important, top-level KPIs right at the top in big, clear widgets. For an ecommerce brand, this would be your overall ROAS and total Revenue. These are your headline numbers—the main plot of your story.
Right below that, you should include trend graphs for these primary metrics. This adds the element of time to your story. Is ROAS trending up after you launched that new ad creative? Did revenue dip during a specific week? This context is what turns data into understanding.
A great dashboard doesn't just show you a number; it shows you the trend behind the number. The goal is to answer "How are we doing?" and "Are we getting better or worse?" in a single glance.
Finally, the bottom of your dashboard is where you can get granular with data tables. This is where you break down performance by individual campaigns, ad groups, or channels. Think of these details as the subplots that explain why your main KPIs are changing. If you need a hand turning complex data into a clear narrative, exploring customized reporting solutions can provide the structure you need to make data-driven decisions with confidence.
Avoiding Common Dashboard Pitfalls
Building an effective dashboard also means knowing what to leave out. Avoid these common traps that turn powerful tools into useless reports.
- The "Vanity Metric" Trap: Resist the urge to showcase metrics like Likes, Follows, or even raw Impressions in a prominent spot unless your goal is purely awareness. These numbers feel good but rarely have a direct line to business success.
- The "Data Overload" Trap: More data is not always better. A dashboard with 50 different metrics is just overwhelming and unusable. Stick to the 5-7 key metrics that are directly tied to your primary business objective.
- The "One-Size-Fits-All" Trap: Don't try to use a single dashboard for every channel. The story of your Google Search ads is completely different from your Meta ads. Create segmented views or separate dashboards to analyze performance in the proper context.
By building a goal-oriented, visually intuitive dashboard, you transform your digital advertising performance metrics from a confusing sea of data into a clear story that guides every strategic decision you make.
Putting Your Metrics into Action
Knowing the difference between ROAS and CTR is a great start, but real growth kicks in when you turn that knowledge into action. The digital advertising performance metrics in this guide aren't just for filling out monthly reports; they're levers you can pull to sharpen your campaigns, allocate budget smarter, and drive strategic growth. Every number tells a story and gives you a clue for your next move.
Think of your metrics as the language of your customers. A low conversion rate might be telling you there’s a gap between what your ad promises and what your landing page delivers. A high Cost Per Acquisition could signal that while your product is great, your targeting is too broad and you're wasting money. Listening to these signals is how you turn an average campaign into a seriously profitable one.
From Data Collection to Decision Making
The goal is to stop passively collecting data and start making confident, data-backed decisions. Instead of just noting a metric, ask why it looks that way and what you can do about it. This proactive approach turns your analytics from a rearview mirror into a GPS guiding your strategy forward.
To start making this shift, here are a few immediate, actionable steps you can take:
- Audit Your Tracking Setup: Make sure your conversion tracking is flawless. Double-check that your analytics platform is accurately capturing every single sale and lead driven by your ads.
- Define One Primary KPI: For your very next campaign, pick a single North Star metric. If it’s an ecommerce campaign, make it ROAS. This focus brings clarity to every decision you make along the way.
- Set Realistic Benchmarks: Use industry data and your own past performance to set goals you can actually hit. This stops you from chasing impossible numbers and helps you measure real progress.
The most successful brands don't just track metrics—they challenge them. They constantly test new creative, refine their audiences, and optimize their landing pages to push their numbers higher, turning insights into tangible results.
By taking these small but critical steps, you start building a system of continuous improvement. If you're ready to fully adopt this approach, exploring data-driven advertising solutions can provide the framework and expertise needed to turn your performance metrics into a powerful engine for sustained business growth.
Frequently Asked Questions
When you're deep in the weeds of digital advertising, a lot of practical questions pop up. Getting clear answers is what turns all this data into smart, profitable decisions for your brand.
Here are some of the most common questions and challenges we see ecommerce advertisers run into.
What Is a Good ROAS for an Ecommerce Business?
Everyone loves to throw around the 4:1 benchmark for Return on Ad Spend (ROAS), which means making $4 for every $1 you spend. But honestly, a "good" ROAS is completely personal to your business. It all comes down to your profit margins.
If you're selling high-margin products, a 3:1 ROAS might be fantastic. On the flip side, a business with tighter margins might need to hit 10:1 or even higher just to stay profitable. The first thing you should do is calculate your break-even ROAS. That’s your baseline—anything above it is profit.
How Do I Track Metrics for Ads on Marketplaces Like Amazon or Walmart?
When you’re advertising on a marketplace, you have to play in their sandbox. Both Amazon and Walmart have their own powerful, built-in analytics dashboards, and you absolutely want to use these native tools for the most accurate data.
- For Amazon: Your world revolves around the Advertising Console. This is your command center for tracking crucial metrics like ACOS (Advertising Cost of Sale), TACoS (Total Advertising Cost of Sale), impressions, clicks, and sales that are directly tied to your campaigns.
- For Walmart: You'll be using the Walmart Connect platform. It offers very similar reporting, letting you see exactly how your ads are performing inside Walmart's ecosystem.
These platforms give you the clearest view of how your ad spend is directly influencing product sales and visibility on their sites.
Which Metric Is More Important: CTR or Conversion Rate?
This is a classic question, and the answer is: they're both important, but they diagnose different problems in your sales funnel. Think of them as a tag team. One gets the customer to your front door, and the other convinces them to come inside and buy something.
Click-Through Rate (CTR) tells you if your ad is doing its job—grabbing attention. A low CTR is a sign that your creative, copy, or targeting is off. Conversion Rate (CVR), on the other hand, tells you if your landing page is doing its job.
It’s a classic scenario: you have a sky-high CTR but a rock-bottom conversion rate. That usually means your ad made a promise that your landing page didn't keep. While both are key, Conversion Rate is closer to the money, making it a more critical signal of your overall success and profitability.
At Next Point Digital, we turn complex data into clear, actionable growth strategies. Our team handles every piece of your advertising puzzle, from fine-tuning marketplace campaigns to building funnels that convert. We make sure every click actually counts.
See how our data-driven approach can scale your brand profitably at https://npoint.digital.