You're spending money on ads, and the biggest question is always the same: Is it actually working? Return on Ad Spend, or ROAS, is the scorecard that tells you if your campaigns are paying off. It cuts right through the noise of vanity metrics like clicks and impressions to give you a straight answer on financial performance.
Think of ROAS as the North Star for your paid advertising. It guides your budget, informs your strategy, and ultimately determines whether you're building a profitable business or just spinning your wheels.
Understanding this one metric is fundamental to scaling your brand. It shows you which campaigns are true money-makers and which ones are just draining your budget. That clarity is non-negotiable if you want to build sustainable growth.
Your No-Nonsense Guide to Calculating ROAS
Before you get lost in complex analytics, ROAS gives you an immediate health check on your ad accounts. It’s a simple, versatile metric that works whether you're a small e-commerce store running a single Facebook ad or a massive enterprise managing a multi-channel budget. The math is easy, but the implications are huge.
The core formula is straightforward:
Total Revenue from Ads ÷ Total Ad Cost
This gives you a clear ratio showing exactly how much you earn for every single dollar you spend.
Why ROAS Is a Critical Starting Point
A ROAS of 4:1 means you're generating $4 in revenue for every $1 spent. This is often seen as a healthy benchmark, but what’s considered "good" can vary wildly depending on your industry and profit margins.
For instance, some industries see much higher returns than others. Context is everything when you're evaluating your performance.
To help you see where you stand, here are some typical ROAS benchmarks across different sectors:
ROAS Benchmarks by Industry
This table showcases average ROAS figures across various industries, helping you contextualize your own performance against established benchmarks.
| Industry | Average ROAS (Ratio) |
|---|---|
| Apparel, Clothing & Accessories | 3.92:1 |
| Health & Beauty | 3.65:1 |
| Home & Garden | 3.51:1 |
| Consumer Electronics | 2.98:1 |
| Automotive | 1.93:1 |
Source: Data from GrowthLoop.com
As you can see, a 2:1 ROAS might be fantastic for an auto parts store but underwhelming for a clothing brand. Knowing your industry's average gives you a realistic starting point for setting your own goals.
A strong ROAS isn't just about big numbers; it's about profitable numbers. It confirms that your targeting, creative, and messaging are resonating with an audience willing to make a purchase, providing a solid foundation for more advanced data-driven marketing strategies.
Putting the Formula into Practice
Let's walk through a real-world scenario to see how this works.
Imagine you run an online store that sells handcrafted leather goods.
- You spend $1,000 on a Google Ads campaign over one month.
- By tracking conversions, you confirm the campaign generated $5,000 in direct sales.
Using the formula, the calculation is simple:
$5,000 (Revenue) ÷ $1,000 (Ad Cost) = 5
This gives you a ROAS of 5, or 5:1. For every dollar you invested in that campaign, you brought in five dollars of revenue. This kind of immediate feedback is incredibly powerful. It tells you whether to scale the campaign, tweak it, or try to replicate its success on other channels.
Mastering this basic calculation is the first step toward building an advertising machine that’s truly optimized for profit.
Finding the Right Numbers for a Trustworthy ROAS
The basic ROAS formula is simple, but its output is only as reliable as the numbers you feed into it. This is where many marketers stumble, leading to calculations that look good on paper but don’t reflect real-world profitability. Garbage in, garbage out—if your cost and revenue data are flawed, your ROAS will be a fantasy metric.
To calculate return on ad spend accurately, you have to pull data from the right sources. The goal is to create a complete and trustworthy picture of your campaign performance, which means knowing exactly where to look for both sides of the equation: cost and revenue.
This visual flow breaks down the simple but powerful ROAS formula into its core components.
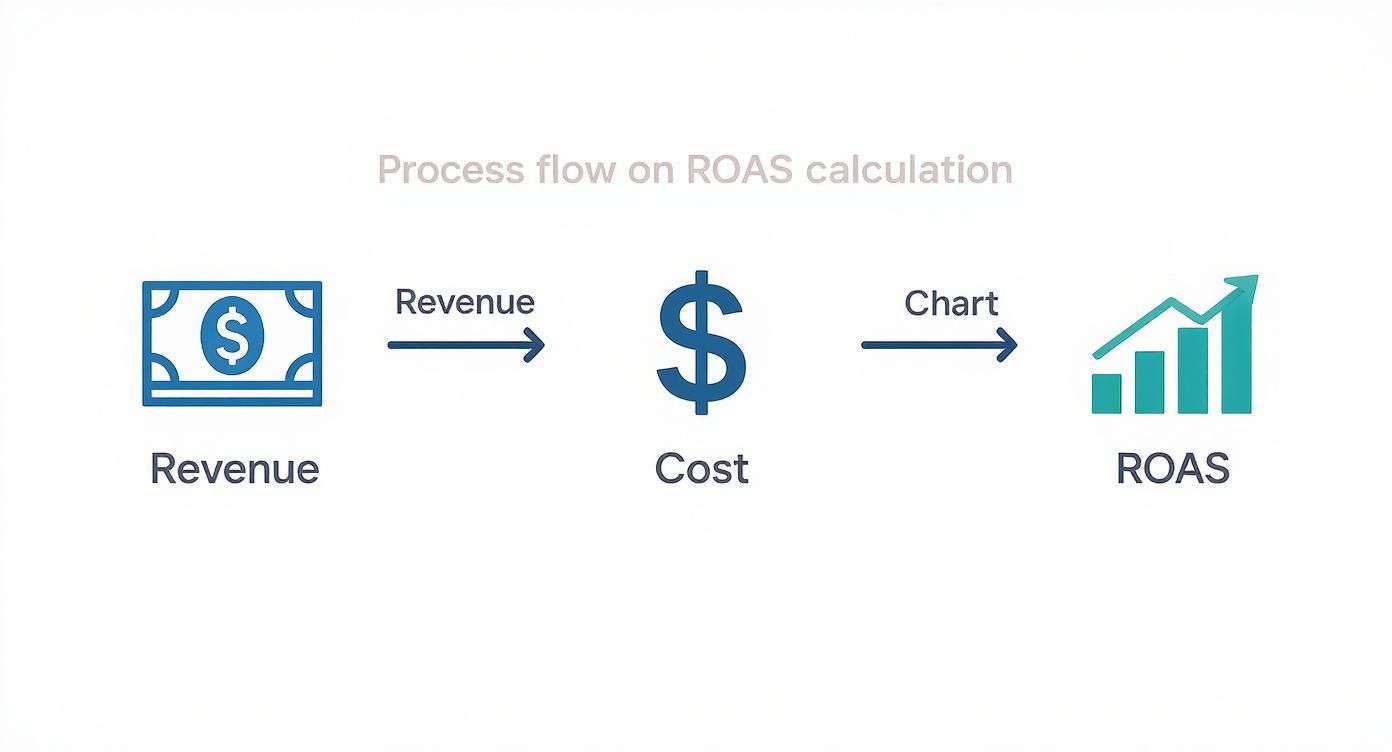
It shows how revenue generated from your ads gets divided by the total ad cost to produce your final ROAS. Simple enough, right? Let's dig into where to find those numbers.
Pinpointing Your Total Ad Cost
Your total ad cost is more than just the daily budget you set in your ad manager. It’s the final, billed amount after all clicks, impressions, and platform fees are tallied up. The most reliable sources for this are the billing or reporting dashboards inside the ad platforms themselves.
- For Google Ads: Head to the "Campaigns" view and set your date range. The "Cost" column will show you the exact spend for that period.
- For Meta Ads (Facebook & Instagram): Just navigate to the Ads Manager. Select your campaigns and the right date range to see the "Amount Spent."
Never estimate these costs. You need to pull the exact figures straight from the source to make sure the "Cost" part of your formula is perfectly accurate.
Remember that a trustworthy ROAS depends entirely on data integrity. A small error in tracking can cascade into significant miscalculations, leading you to scale unprofitable campaigns or kill winning ones.
Tracking True Ad-Driven Revenue
Attributing revenue correctly is often the trickiest part. A customer might see a Facebook ad, later search for your brand on Google, and then finally make a purchase. So, which channel gets the credit? This is where a proper tracking setup becomes non-negotiable.
Your primary source of truth for revenue should be your e-commerce platform or analytics tool, not just the ad platform's dashboard. Ad platforms often use different attribution models that can inflate their own performance numbers.
Common Revenue Tracking Sources:
- Google Analytics 4 (GA4): By setting up e-commerce tracking and using UTM parameters on all your ad links, you can see exactly which campaigns, ad sets, and ads are driving sales.
- E-commerce Dashboards: Platforms like Shopify, BigCommerce, or WooCommerce have built-in analytics that can tie sales directly back to their traffic source.
- Third-Party Attribution Tools: For more complex customer journeys, dedicated software can provide a more holistic view of how different touchpoints contribute to a final sale.
For example, a Shopify store owner should cross-reference the sales reported in Meta Ads Manager with the sales attributed to "Facebook" in their Shopify Analytics. If there's a huge discrepancy, it’s a red flag that your tracking pixel or UTM setup might be faulty. Accurately tracking revenue is fundamental, just as important as knowing how to determine the price of a product for profit in the first place.
Ultimately, clean data is the bedrock of a meaningful ROAS. To ensure your calculations are always accurate, it's essential to continually learn how to improve your data quality for reliable business reporting. Without it, you’re just guessing.
Moving Beyond the Basic ROAS Formula
The standard ROAS formula is a great starting point. It gives you a quick, top-level look at how your campaigns are doing. But if you stop there, you’re only getting half the story. It's like looking at your total sales without ever checking your profit margin—a high number can easily hide a money-losing operation.
To really get a grip on your advertising's financial health, you need to go deeper. A flashy ROAS looks fantastic in a report, but if your product margins are thin, that impressive number could be masking an unprofitable campaign. This is where the more advanced ROAS calculations come in. They separate the vanity metrics from actual profitability.
Uncovering True Profitability with Net ROAS
The basic formula is often called "Gross ROAS" because it only looks at gross revenue against your ad costs. It completely ignores all the other expenses that eat into your bottom line. Net ROAS, on the other hand, factors in your profit margin to give you a much more realistic picture.
To calculate it, you first need to figure out your gross profit from the sales your ads generated. That means subtracting the Cost of Goods Sold (COGS) from your revenue.
Here’s the formula:
Net ROAS = (Gross Revenue from Ads – COGS) ÷ Total Ad Cost
Let’s run the numbers. Say you spent $2,000 on ads and brought in $8,000 in revenue.
- Your Gross ROAS is a solid 4:1 ($8,000 ÷ $2,000). Looks good, right?
- But let's say the COGS for those products was $5,000.
- That means your actual profit was only $3,000 ($8,000 – $5,000).
Now, your Net ROAS is $3,000 (Profit) ÷ $2,000 (Ad Cost) = 1.5. A 1.5:1 Net ROAS tells a completely different story. You're still in the black, but it makes it crystal clear how much product costs are impacting your advertising success.
Calculating Your Break-Even ROAS
What's the absolute lowest ROAS you can hit before you start losing money? That's your Break-Even ROAS. Knowing this number is non-negotiable—it’s the baseline for every campaign you run. Anything below it, and you're paying to give your products away.
The calculation is surprisingly simple but incredibly powerful:
Break-Even ROAS = 1 ÷ Profit Margin
To get your profit margin, just use this formula: (Revenue – COGS) ÷ Revenue.
Let’s use an example. You sell a product for $100, and the COGS is $60.
- Your profit on each sale is $40 ($100 – $60).
- Your profit margin is 40% ($40 ÷ $100).
- Your Break-Even ROAS is 1 ÷ 0.40 = 2.5.
This means you must generate at least $2.50 in revenue for every $1 you spend on ads just to cover your costs. Any ROAS above 2.5:1 is pure profit. This one calculation gives you a clear, hard target for every campaign. One of the best ways to get above this line is by improving your landing pages; for more ideas, check out our guide on conversion rate optimization strategies.
Factoring in Long-Term Success with LTV-Adjusted ROAS
For many businesses, the first sale is just the beginning of the journey. If you have a subscription model or customers who come back again and again, focusing only on that initial purchase is short-sighted. This is where LTV-Adjusted ROAS shines by painting a long-term picture of your ad performance.
LTV, or Customer Lifetime Value, represents the total profit you expect from a customer over their entire relationship with your brand.
Here's the formula:
LTV-Adjusted ROAS = (Customer LTV x Number of New Customers from Ads) ÷ Total Ad Cost
Imagine you spend $5,000 on a campaign that brings in 100 new customers. The initial revenue is $10,000, giving you a standard ROAS of 2:1. This might look weak, especially if your break-even point is higher.
But what if your data shows that the average LTV of a new customer is $250?
- The total lifetime value you just acquired is $25,000 (100 customers x $250 LTV).
- Your LTV-Adjusted ROAS is actually $25,000 ÷ $5,000 = 5.
A 5:1 LTV-Adjusted ROAS completely changes the narrative. It proves that while the immediate return was just okay, the long-term value is massive.
This forward-looking view is more important than ever. With global digital ad spend projected to hit $740.3 billion in 2024, and search advertising making up $306.7 billion of that, the competition is fierce. Focusing on LTV helps justify a higher cost to acquire valuable, long-term customers who will pay off for years to come.
By moving beyond the basic formula, you gain a multi-dimensional view of performance. Net ROAS tells you about immediate profitability, Break-Even ROAS sets your performance floor, and LTV-Adjusted ROAS reveals the long-term value of your ad spend.
Comparing ROAS Calculation Methods
To help you decide which ROAS metric fits your needs, here’s a quick comparison of the different methods we've covered. Each one offers a unique perspective on your ad performance.
| ROAS Type | Formula | Best For |
|---|---|---|
| Gross ROAS | (Revenue from Ads) ÷ (Total Ad Cost) | Quick, high-level campaign health checks and platform comparisons. |
| Net ROAS | (Revenue – COGS) ÷ (Total Ad Cost) | Getting a true picture of immediate, real-world profitability. |
| Break-Even ROAS | 1 ÷ (Profit Margin) | Setting clear, non-negotiable performance targets for campaigns. |
| LTV-Adjusted ROAS | (LTV x New Customers) ÷ (Total Ad Cost) | Businesses with repeat purchases or subscriptions to measure long-term value. |
Choosing the right metric depends entirely on what you're trying to measure. Are you focused on immediate cash flow, or are you building a long-term customer base? Using a mix of these calculations will give you the most complete and actionable insights.
Calculating ROAS on Amazon, Walmart, and eBay
Calculating your return on ad spend isn't a simple copy-paste job, especially when you're juggling major marketplaces. Platforms like Amazon, Walmart, and eBay are walled gardens, each with its own advertising tools, reporting quirks, and definitions of success. If you apply a generic formula across all of them, you're going to get skewed data and make some costly mistakes.
These platforms aren't just storefronts; they control the entire customer journey, from the ads they see to the data you get back. To get a real read on your performance, you have to play by their rules and understand what their numbers actually mean.
Amazon Advertising and the Power of TACoS
On Amazon, getting your basic ROAS is easy. The ad console spits it out for you by dividing your ad-attributed sales by your ad spend. But if you stop there, you're missing the bigger picture. Relying only on that number ignores the powerful "halo effect" of your advertising.
Well-run Amazon ads do more than just drive immediate sales. They boost your product's organic ranking, which leads to more organic, non-paid sales down the line. This is where a smarter metric, Total Advertising Cost of Sale (TACoS), comes into play.
TACoS measures your ad spend against your total revenue—both ad-driven and organic—not just the sales from your ads.
TACoS Formula = Total Ad Spend ÷ Total Revenue
If your TACoS is trending downward over time, even while your ad spend is steady or increasing, it’s a fantastic sign. It means your ads are creating a flywheel effect, making your products easier to find and buy without someone having to click an ad first. For anyone new to selling on the platform, getting a grip on the whole ecosystem is step one. You can learn more about the fundamentals in our comprehensive guide to what is PPC on Amazon.
For Amazon sellers, ROAS tells you if an ad is working today, but TACoS tells you if your advertising strategy is building a sustainable business for tomorrow.
Measuring eBay Promoted Listings
eBay’s main advertising tool, Promoted Listings, runs on a cost-per-sale model. This is pretty straightforward: you only pay an ad fee when a buyer clicks your promoted ad and actually buys your item within 30 days. This setup makes calculating your ROAS a breeze.
Your ad cost is the ad fee you paid, and the revenue is the item's sale price.
- Ad Revenue: The final sale price of the item sold through a Promoted Listing.
- Ad Cost: The ad fee percentage you set, multiplied by the final sale price.
Let's walk through it. Say you sell a $100 item using a 7% Promoted Listings ad rate.
- Your Ad Cost is $7 ($100 x 0.07).
- Your Ad Revenue is $100.
- Your ROAS is $100 ÷ $7 ≈ 14.3.
eBay gives you all this data right in the Seller Hub under the "Performance" tab. This makes it easy to see which listings are getting the biggest boost from promotion so you can tweak your ad rates. The key here is to watch the sales lift and make sure the ad fee is actually worth the extra sales velocity you're getting.
Navigating Walmart Connect’s Closed-Loop Reporting
Walmart Connect, the retail giant’s ad platform, loves to talk about its closed-loop reporting. What this actually means is that it can directly connect an ad someone saw to an eventual purchase they made, whether it was online or in-store. This gives you a uniquely powerful view of how your campaigns are really influencing shoppers.
When you're calculating ROAS on Walmart, you have to be precise about which revenue you're looking at. Your dashboard in Walmart Connect will show you the sales attributed to your Sponsored Products campaigns.
Here’s what you need to zero in on:
- Attributed Sales: This is the revenue Walmart has directly tied back to your ad campaigns.
- Ad Spend: The total cost of those campaigns over a given period.
The formula itself is the standard (Attributed Sales ÷ Ad Spend), but the real value is in Walmart's data accuracy. Because they own the entire transaction from start to finish, the attribution is incredibly reliable. The trick is to play with the different attribution windows—like 3-day, 14-day, and 30-day—to see how long it takes for a customer to convert after seeing your ad. This helps you understand the full impact of your campaigns, not just the immediate clicks and sales.
Actionable Strategies to Dramatically Improve Your ROAS
Knowing your numbers is the first step, but the real goal is to make them better. Once you can confidently calculate return on ad spend, you can start pulling the levers that actually increase it. Improving your ROAS isn't about finding a single magic bullet; it's about making a series of smart, data-backed optimizations that compound over time.
This isn't just about tweaking your ad budget. It's about refining every part of the customer journey, from the first ad they see to the final click on your landing page. Let's break down the battle-tested strategies that turn a decent ROAS into a great one.

Laser-Focus Your Audience Targeting
The fastest way to burn through your ad budget is by showing ads to the wrong people. Every irrelevant click is a wasted dollar that drags your ROAS down. The key is to move from broad targeting to a laser-focused approach that reaches high-intent buyers.
Start by digging into your own data. Who are your best customers? Don't guess—look at the demographics, interests, and behaviors of people who have already purchased from you.
Actionable Targeting Tactics:
- Build Lookalike Audiences: Upload a list of your best customers to platforms like Meta or Google and let their algorithms find new people with similar characteristics.
- Utilize In-Market Segments: Target users who are actively researching products or services like yours right now.
- Refine Geographic Targeting: If you notice a specific city or region has a higher conversion rate, double down on that area and reduce spend elsewhere.
This isn't about shrinking your audience; it's about improving its quality. A smaller, highly relevant audience will always outperform a large, indifferent one.
A high ROAS begins with ruthless audience qualification. Stop paying to show ads to people who will never buy. Instead, focus your budget on the segments most likely to convert, maximizing the return on every impression.
A/B Test Your Ad Creatives Relentlessly
Your ad creative is your digital storefront. A weak headline or a boring image can kill a campaign before it even has a chance. You have to continuously test different elements to find the combinations that resonate most with your audience.
Never assume you know what will work best. Run controlled A/B tests on different components of your ads to see what drives the highest engagement and conversions.
Elements to Test:
- Headlines: Try different angles—ask a question, state a benefit, or create urgency.
- Images & Videos: Test lifestyle photos vs. product-focused shots, or short, punchy videos vs. longer, more detailed ones.
- Call-to-Action (CTA): See if "Shop Now" performs better than "Learn More" or "Get 20% Off."
Even a small lift in your click-through rate from a winning creative can have a significant positive impact on your final ROAS. For those looking to continuously enhance their ROAS, diving into advanced campaign optimization strategies is crucial.
Master Your Bid Strategy with Negative Keywords
Paying for clicks from people searching for things you don't offer is a surefire way to destroy your ROAS. This is where negative keywords become one of your most powerful tools, especially in search campaigns on platforms like Google.
Negative keywords tell the ad platform which search terms you don't want your ads to show up for. For example, if you sell premium leather shoes, you'd want to add negative keywords like "cheap," "repair," and "used" to filter out unprofitable traffic.
Regularly review your search term reports to find irrelevant queries that are triggering your ads and costing you money. Adding them to your negative keyword list is an immediate and effective way to plug leaks in your budget and direct your spend toward more qualified searchers.
The advertising world is only getting more competitive. The constant pressure to perform is amplified by surging ad spend, which is projected to cross the $1 trillion mark globally for the first time in 2025. This massive investment makes precise measurement and optimization more important than ever for marketers trying to justify their budgets.
Optimize Your Landing Page for Conversions
You can have the best ad in the world, but if it sends traffic to a slow, confusing, or untrustworthy landing page, your ROAS will suffer. The landing page is where the conversion happens, so it needs to be flawless.
Your page must deliver on the promise made in the ad. Make sure the messaging, imagery, and offer are perfectly aligned. A disconnect between the ad and the landing page is a major cause of high bounce rates.
Key Landing Page Improvements:
- Improve Load Speed: Every second counts. A slow-loading page will send potential customers clicking away.
- Simplify the Design: Use a clean layout with a clear headline, compelling visuals, and a single, obvious call-to-action.
- Ensure Mobile-Friendliness: The majority of ad traffic is mobile. Your page must look and function perfectly on a smartphone.
Improving your landing page is a critical part of a holistic approach. These adjustments work together with other efforts, which is why it's important to understand the best ecommerce marketing strategies as a whole.
Answering the Big Questions About ROAS
Once you get the hang of the formulas, you'll start thinking about the bigger picture. What do these numbers really mean for your business? Let's dive into the questions that pop up once you move from just calculating ROAS to using it for smart decisions.
These are the practical, real-world questions that bridge the gap between reporting a number and truly understanding its impact on your bottom line.
What Is a Good ROAS?
This is the million-dollar question, and the honest-to-goodness answer is: it depends. A "good" ROAS is completely tied to your profit margins, operating costs, and the overall financial health of your business. A 10:1 ROAS might be incredible for one company but barely break-even for another selling products with razor-thin margins.
That said, there is a widely accepted benchmark that works for many industries: a 4:1 ratio. This means you’re bringing in $4 in revenue for every $1 you spend on ads. For most businesses, that leaves enough room to cover the cost of your products, the ad spend itself, and other operational costs while still turning a decent profit.
But don't get hung up on a single magic number. The best way to think about it is to use your Break-Even ROAS as your absolute floor—the minimum you need to not lose money. Then, use that 4:1 ratio as a solid target to aim for.
What Is the Difference Between ROAS and ROI?
People throw these terms around interchangeably, but they measure two totally different things. Mixing them up can give you a dangerously incomplete picture of how your business is actually doing.
Here’s the simplest way to think about it:
- ROAS measures gross revenue generated by your ad spend. It’s a tactical metric that zeroes in on the effectiveness of a specific ad campaign. It answers the question, "For every dollar I put into this ad, how many dollars in sales did I get back?"
- ROI measures net profit against your total investment. This is a strategic, big-picture metric that tells you about overall business profitability. It takes all costs into account—ad spend, COGS, shipping, software, salaries—to answer the question, "After everything was paid for, was this whole effort profitable?"
A campaign can have a fantastic ROAS and still have a negative ROI. This happens all the time. The revenue from the campaign might be way more than the ad spend, but it wasn't enough to cover the cost of the products themselves and all the other expenses.
How Often Should I Check My ROAS?
It’s tempting to hit refresh on your ad dashboard every hour, but checking your ROAS daily is usually a waste of time and energy. Ad performance swings up and down naturally, and a single bad day can trigger unnecessary panic. This leads to knee-jerk reactions, like pausing a campaign that just needed a little more time to find its groove.
You also have to account for attribution windows. Someone might see your ad on a Monday but not pull the trigger and buy until Friday. If you only look at Monday's ROAS, you'll completely miss that conversion and think the ad was a failure.
A more disciplined reporting schedule will lead to much smarter decisions.
- Weekly Checks: This is your time to monitor general trends and spot any glaring red flags. Are your costs per click suddenly through the roof? Did a campaign that was crushing it suddenly fall off a cliff?
- Monthly or Bi-Weekly Analysis: This is where you do your real strategic thinking. Looking at a full month of data smooths out the daily noise and gives attribution models enough time to catch all those delayed conversions. This stable, reliable picture is what you should use to make decisions about budget, targeting, and creative.
By sticking to a schedule, you can focus on the meaningful trends that actually drive growth instead of getting lost in the day-to-day chaos.
At Next Point Digital, we turn complex data into clear, actionable growth strategies. If you're ready to move beyond basic calculations and build a truly profitable advertising machine, we can help. Schedule a consultation with us today and let's start converting your ad spend into significant sales.