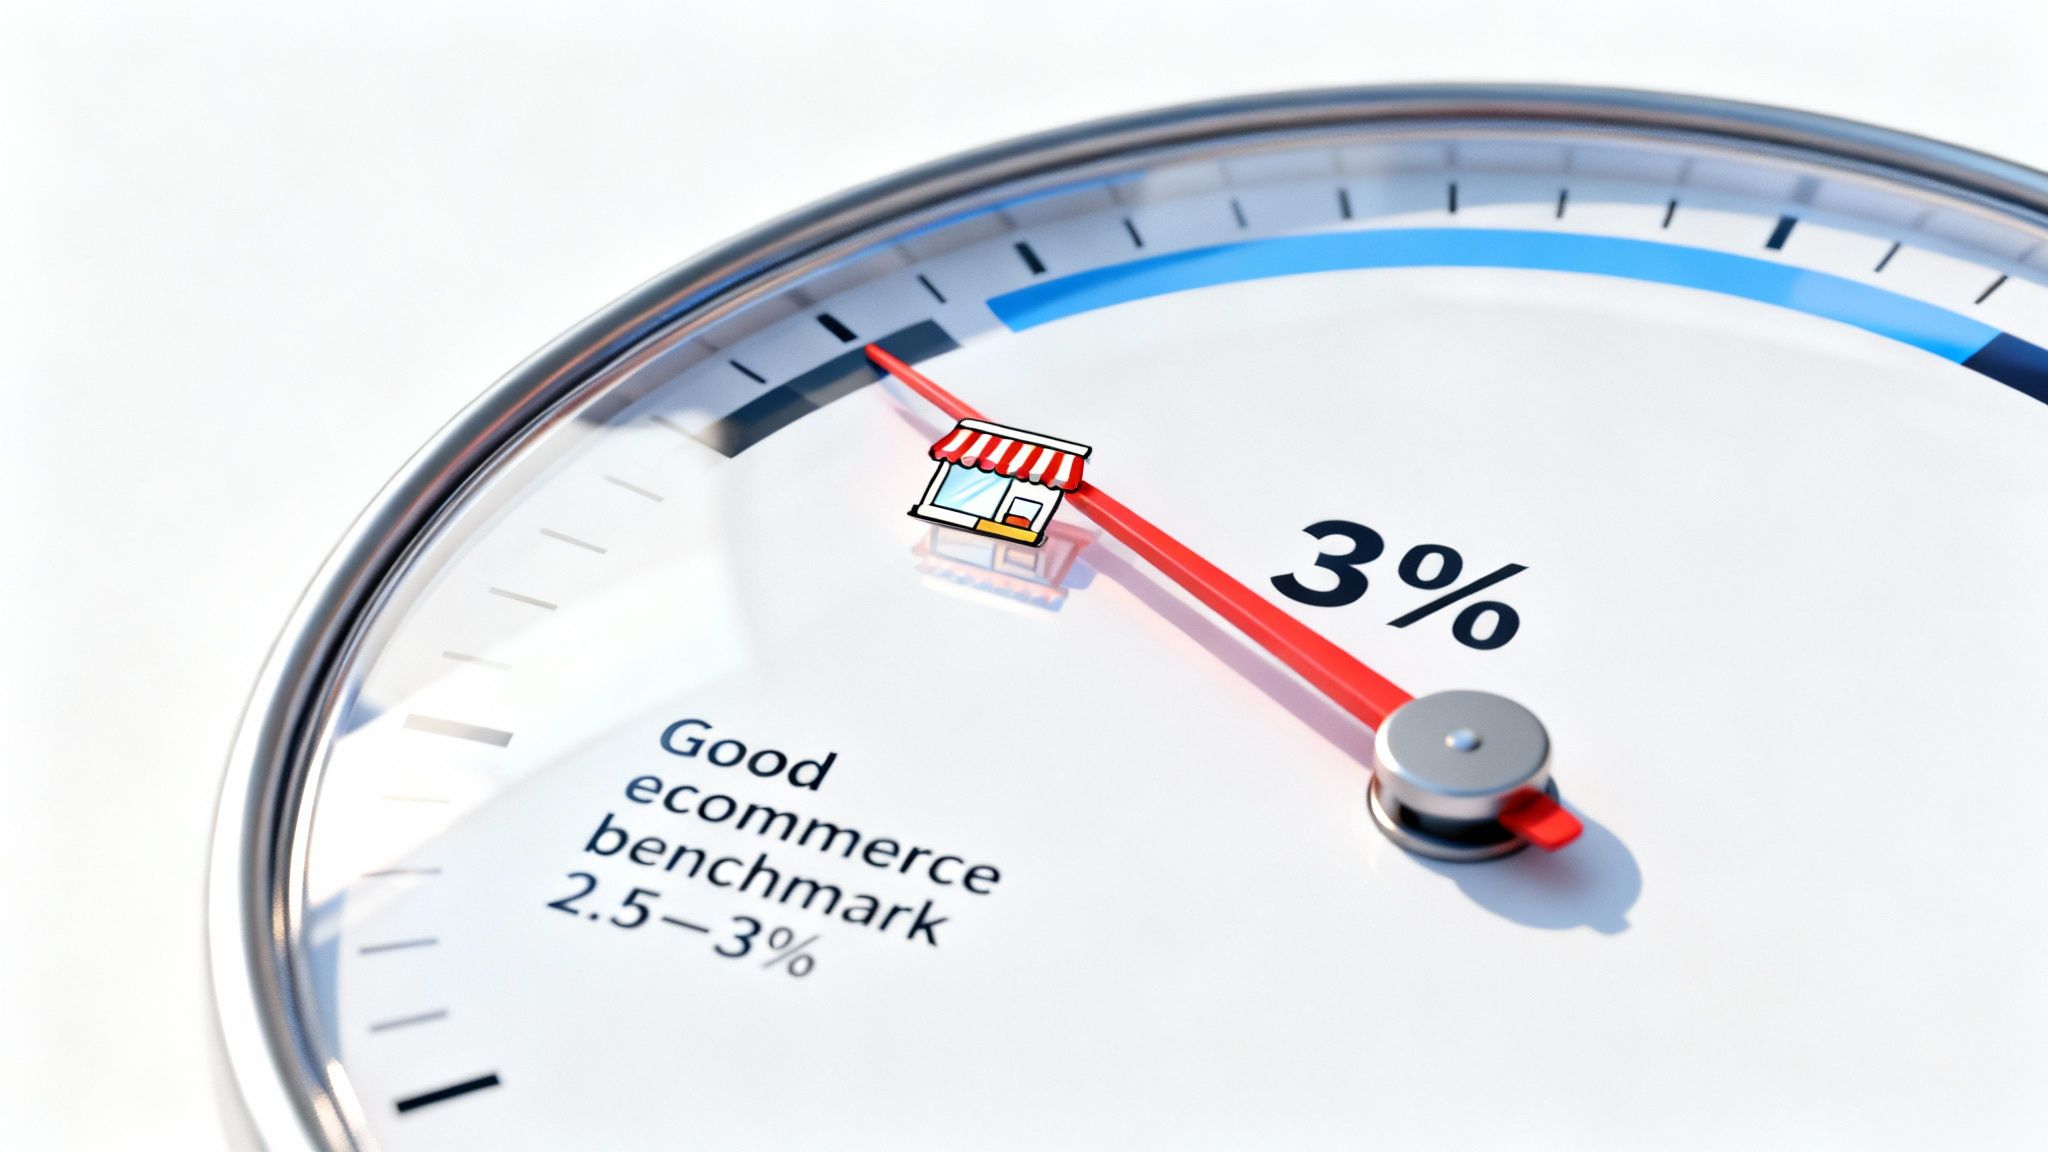
When someone asks, "what is a good conversion rate?" the quick answer is usually between 2.5% and 3%. Think of that range as a healthy starting point—a solid baseline for turning your website visitors into actual customers. But honestly, that number is just the beginning of the story.
Defining Your Ecommerce Conversion Rate Benchmark
Think of your conversion rate like a car's fuel efficiency. You wouldn't expect a heavy-duty truck to get the same MPG as a compact car, right? It’s the same in ecommerce. What counts as a “good” conversion rate changes dramatically based on what you sell, where you sell it, and who you’re selling to.
For a luxury D2C brand selling high-ticket items, a 1% rate might be fantastic. Meanwhile, a high-volume Amazon seller might feel that 4% is underperforming. This is why looking past that single global average is so important. Your real performance standard is shaped by the specific factors that define your business.
Key Factors That Influence Your Benchmark
Before you can set a realistic goal, you have to get a handle on the variables at play. For brands on competitive marketplaces like eBay and Walmart, these nuances matter even more. The biggest factors include:
- Industry and Product Category: Everyday essentials like groceries will almost always have higher conversion rates than expensive, considered purchases like furniture.
- Traffic Quality and Source: A visitor coming from a trusted referral link is usually far more ready to buy than someone who just clicked a social media ad.
- Customer Device: People behave differently on desktop versus mobile. That difference has a huge impact on how many of them actually complete the checkout process.
Industry data shows that a solid ecommerce conversion rate for 2025 lands somewhere between 2.5% and 3%. This range is a strong target for most brands, whether you're D2C or selling on a marketplace. While established stores often hit 2.5-4%, it's not uncommon for newer shops to see rates closer to 1.4%. You can explore more about these ecommerce averages to see how business stage and industry can affect performance.
The best way to measure success isn't against some universal average, but against your own tailored benchmark. Understanding the context behind the numbers is the first step toward meaningful growth.
To give you a grounded, at-a-glance idea of where you might stand, here’s a quick look at some common benchmarks.
This table offers a high-level summary of average conversion rates across different ecommerce dimensions. Use it as a quick reference to see where your brand fits in.
Quick Guide to Ecommerce Conversion Rate Benchmarks
| Category | Benchmark Range | Key Insight |
|---|---|---|
| Overall Ecommerce Average | 2.5% – 3.0% | This is a strong starting point for most D2C and marketplace sellers. |
| Top-Performing Stores | 4.0% – 6.0%+ | High trust, optimized user experience, and strong traffic quality are common traits. |
| Mobile Devices | 1.8% – 2.5% | Lower than desktop, often indicating friction in the mobile checkout process. |
| Desktop Devices | 3.5% – 4.5% | Higher rates are driven by easier navigation and a more focused buying environment. |
These numbers aren't rules, but they provide crucial context. Knowing them helps you set realistic goals and identify the right areas for improvement.
Why Generic Benchmarks Can Steer You Wrong
Chasing a universal "good" conversion rate is like comparing a sports car's MPG to a semi-truck's. It's a pointless exercise because they're built for completely different jobs. What works for one ecommerce business can be a recipe for disaster for another, and applying a one-size-fits-all number strips away all the context that actually matters.
This obsession with a generic percentage often sends brands down the wrong path. You might find yourself celebrating a "good" conversion rate while your profit margins are paper-thin, or panicking over a "low" one when your business is actually quite healthy. The real story isn't in the rate itself, but in the business model behind it.
The AOV and Profit Margin Paradox
Let's look at two completely different ecommerce brands. A luxury watch company might have a conversion rate of just 1%. At first glance, that seems terrible. But if their average order value (AOV) is $5,000, that 1% translates into massive revenue and profit from every single sale. They don't need high volume to win; they need high value.
Now, think about a brand selling trendy phone cases for $15. They might boast an incredible 6% conversion rate. While that number looks impressive on a dashboard, their tiny AOV means they have to sell an enormous volume of products just to cover their operating costs and ad spend. Even though they convert six times better than the watch brand, their thin margins could put them in a really tight spot.
A low conversion rate can be highly profitable with a high AOV, while a high conversion rate can be unsustainable with a low AOV. Profitability, not the conversion percentage, is the ultimate measure of success.
This shows exactly why you can't just fixate on the rate. You have to look at the financial engine driving your business. Evaluating your performance means digging deeper into the variables that shape your reality. For a detailed breakdown of how to connect these metrics to your overall growth goals, see our guide on how to scale an ecommerce business.
Key Variables That Define Your “Good” Rate
Several critical factors determine what a good conversion rate actually looks like for your store. If you ignore them, you're flying blind.
- Product Price Point: Just like in our example, higher-priced items naturally have a longer consideration phase and, therefore, lower conversion rates. A customer might impulse-buy a $10 snack, but they’ll spend weeks researching a $1,000 appliance.
- Customer Purchase Intent: Where your traffic comes from is huge. A visitor who clicks a highly targeted "buy now" search ad has far stronger intent than someone who casually tapped a link in a social media post while scrolling.
- Brand Recognition: Established brands with solid reputations almost always see higher conversion rates. Customers already trust them, which removes a major roadblock to purchase that newer brands have to work hard to overcome.
Ultimately, the goal is to stop chasing some arbitrary industry average and start listening to the story your own data is telling. By analyzing these contextual factors, you can set realistic goals that truly reflect your business's health and pave the way for real, sustainable growth.
Unpacking Conversion Rate Benchmarks by Industry
Trying to define a "good conversion rate" without looking at your specific industry is like asking a chef for a universal cooking time. It works for a hard-boiled egg, but you wouldn't use it for a Thanksgiving turkey. A generic benchmark might say 3% is the magic number, but that's wildly optimistic if you're selling high-end furniture and potentially too low if you're selling snack bars.
To set goals that actually make sense, you need to look at your direct competitors. The context of your market—customer habits, how often they buy, and how much thought goes into a purchase—creates huge differences in conversion rates.
Think about it: a customer grabbing a bag of chips is making a quick, low-risk decision. But someone shopping for a new sofa? That's a major investment. They'll likely spend weeks researching, comparing options, and reading every review they can find before pulling the trigger.
This is perfectly illustrated by comparing two completely different businesses. A 1% conversion rate for a luxury watch brand can be just as successful as a 6% rate for a snack company, and it all comes down to context.
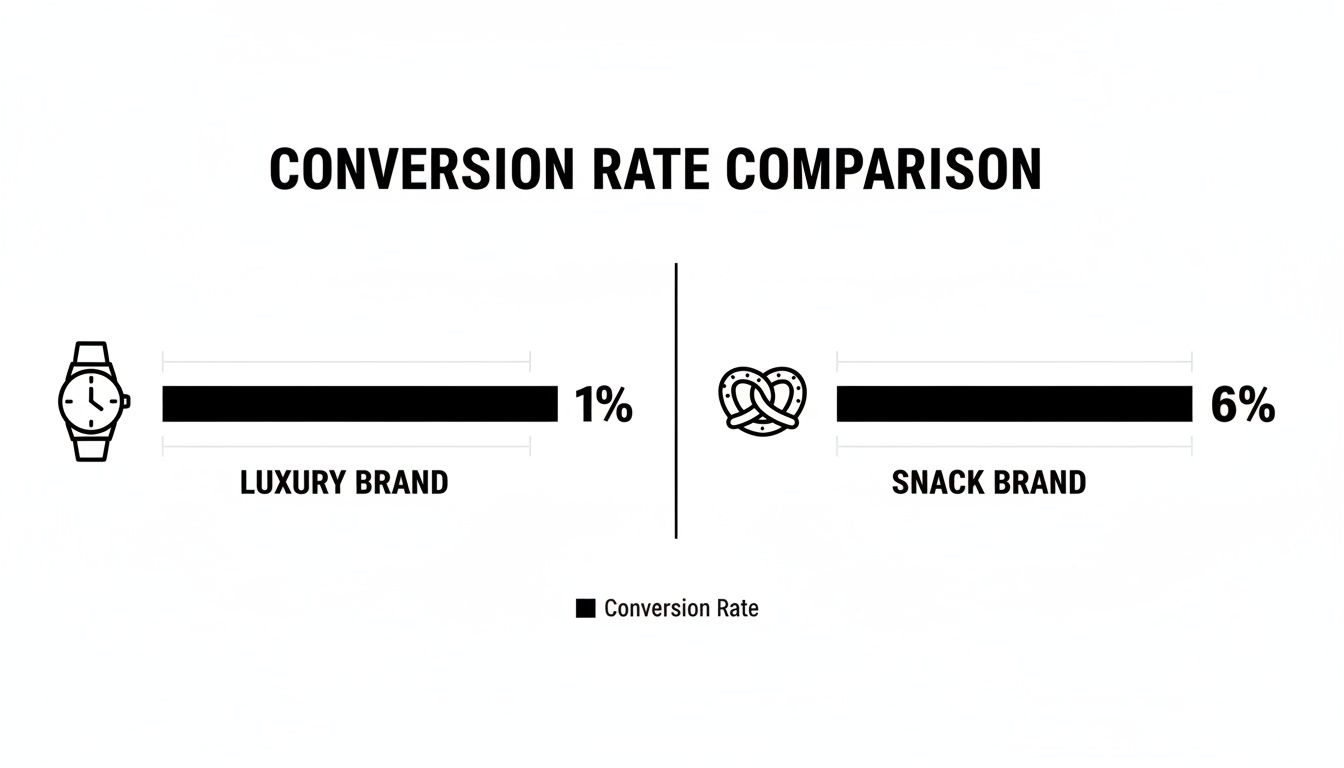
As you can see, the watch brand's sky-high average order value (AOV) makes its lower conversion rate incredibly profitable. Meanwhile, the snack brand relies on high volume to achieve its success.
High-Frequency Versus High-Consideration Purchases
At its core, the difference between industry benchmarks boils down to one thing: purchase frequency. Industries selling essential, consumable, or low-cost goods almost always see higher conversion rates because customers buy them regularly with little hesitation.
In ecommerce, industry-specific data is what truly defines 'good.' For instance, the food & beverage and personal care categories are expected to hit 6.11% and 6.8% respectively. These sectors thrive on frequent, low-friction purchases—think daily essentials versus a once-a-decade splurge. On the flip side, home decor lags at 1.4% because of the decision paralysis that comes with big-ticket items.
What a good conversion rate looks like is fundamentally tied to customer psychology. Low-cost, high-trust items convert quickly, while expensive, long-term purchases require a much longer and more considered buying journey.
This is exactly why a D2C beauty startup should be aiming for a benchmark closer to 6.8%, not the generic 3%. Their target reflects the repeat-purchase nature of their industry. At the same time, an online mattress company might celebrate a 1.5% conversion rate because their high AOV makes every single sale incredibly valuable.
Ecommerce Conversion Rate Benchmarks by Industry
To set realistic targets, you need to know where your specific category stands. This is especially true for brands selling on massive marketplaces where competition is fierce and category-specific performance is everything. Digging into this data also helps you understand the real potential of your product category. For a deeper look at performance metrics, our guide on interpreting Amazon sales data offers even more context.
Here’s a quick look at average conversion rates across several key ecommerce industries.
This table offers a comparative look at average conversion rates across different product categories, helping brands benchmark their performance against direct competitors.
| Industry / Product Category | Average Conversion Rate | Performance Driver |
|---|---|---|
| Personal Care & Beauty | 6.8% | High repeat purchase rate and brand loyalty |
| Food & Beverage | 6.11% | Essential goods with frequent, subscription-friendly buys |
| Pet Care | 4.2% | Strong emotional connection and routine purchases |
| Fashion & Apparel | 2.44% | Trend-driven, but high competition and returns lower rates |
| Home Decor & Furniture | 1.4% | High-ticket items requiring long consideration periods |
| Luxury & Jewelry | 0.9% | Very high AOV, focused on a small number of high-value sales |
By using these industry-specific numbers, you can move away from vague goals and toward actionable targets that reflect the reality of your market. This allows you to measure what truly matters and build a CRO strategy that makes sense for your business.
How Your Traffic and Device Type Shape Success

Defining "what is a good conversion rate" gets a lot clearer once you accept that not all visitors show up with the same intent to buy. Where your traffic comes from and what device they’re using are two of the biggest factors that will make or break your success. Ignoring them is like trying to navigate without a map—you're missing the context that should be guiding your entire strategy.
Think of your online store like a physical shop. A customer who clicks a referral link is like someone walking in with a personal recommendation from a trusted friend. They already have a reason to trust you, they probably know what they’re looking for, and they’re far more likely to buy something. Their path to purchase is short and sweet.
On the other hand, a visitor from a social media ad is more like a window shopper. They were scrolling their feed, something caught their eye, and they decided to pop in for a browse. Their buying intent is way lower. Turning them into a customer takes a lot more work.
The Power of High-Intent Traffic Sources
The data doesn't lie: some traffic channels are just flat-out better at driving sales. It makes sense, right? Visitors actively looking for a solution are naturally closer to buying than those who just stumble upon your brand. This is why knowing your traffic mix is so important for setting realistic goals.
Paid search and referral traffic, for instance, almost always crush other channels. When someone types a specific product into Google, they’re practically raising their hand to say, "I want to buy this." A click from a trusted blog review carries that same kind of weight.
Recent numbers show just how wide this gap can be. In 2025, paid search is leading the pack with an average conversion rate of 3.2%, with referral traffic right behind it at 2.9%. Meanwhile, social media often struggles to convert at less than 1%. The lesson here is simple: focus on high-intent channels. You can explore more insights on conversion rates by traffic source from Ruler Analytics to see how your industry stacks up.
A "good" conversion rate is often a direct reflection of traffic quality. Doubling down on channels that deliver motivated buyers is one of the fastest ways to lift your overall performance.
This is a critical piece of the puzzle for marketplace sellers and D2C brands alike. Whether you're running Amazon ads or pouring money into your own site’s SEO, knowing which channels actually deliver helps you put your budget where it belongs.
Bridging the Mobile Conversion Gap
The second piece of the puzzle is the device your customers are using. For years, ecommerce brands have stared down a frustrating problem: mobile traffic is through the roof, but mobile conversion rates are still lagging far behind desktop. This creates a massive revenue gap that too many businesses just ignore.
Think about the last time you tried to buy something on a clunky mobile site. Pinching and zooming to fill out tiny forms, waiting for pages to load, and hunting for the checkout button. It’s a pain. That friction is exactly why so many mobile shoppers give up and abandon their carts.
The numbers tell the story loud and clear. On average, desktop conversion rates are around 3.9%, while mobile is stuck at a measly 1.8%. Mobile might bring in most of the traffic, but the experience is often treated like an afterthought, costing brands countless sales.
Optimizing for mobile isn't just a good idea; it's a must. Here are a few key areas to dial in:
- Streamline Your Checkout: Kill unnecessary steps and form fields. Make it fast.
- Offer Mobile-Friendly Payments: Integrate options like Apple Pay, Google Pay, and PayPal.
- Improve Site Speed: Your pages need to load instantly, especially on mobile connections.
By closing this gap, you can tap into a huge segment of your audience that’s ready to buy but is being held back by a bad user experience. Our guide on how to increase ecommerce sales offers more practical tips for boosting your mobile performance and overall conversion strategy.
How to Calculate and Track Your Conversion Rate
Understanding your conversion rate is one thing, but knowing how to measure it accurately is where the real power lies. Thankfully, you don’t need a complicated process to get started. The calculation itself is pretty straightforward and sets the foundation for all your optimization work.
At its core, the formula is simple:
Conversion Rate = (Total Number of Conversions / Total Number of Visitors) x 100
So, if your product page got 10,000 visitors last month and you made 250 sales, your conversion rate is 2.5%. This single percentage tells you how well you’re turning casual browsers into actual buyers.
Defining Your Terms for Accurate Measurement
While the formula is easy, the accuracy of your results depends entirely on how you define "conversions" and "visitors." Getting this wrong can give you a skewed view of your performance and lead you down the wrong path.
- What is a Conversion? This is the main action you want a visitor to take. For most ecommerce brands, that’s a completed purchase. It has to be a specific, trackable event.
- What is a Visitor? This usually refers to a unique user or a session within a certain timeframe. Using "sessions" is common because one person might visit your site multiple times before finally buying something. The key is to be consistent.
Decide on your definitions and stick to them. If you keep changing how you measure things, you won't be able to spot real trends over time, and your data will be unreliable.
Finding Your Data in Key Platforms
Knowing the formula is only half the battle; you also need to know where to find the numbers. Each platform serves this data up a bit differently.
- Google Analytics: This is the command center for most D2C brands. You can find traffic (Users or Sessions) and conversion data by setting up "Goals"—like a visitor reaching your thank-you page—or by enabling Ecommerce Tracking to see transactions, revenue, and your conversion rate calculated automatically.
- Shopify: Your main Shopify Dashboard gives you a quick snapshot of your online store's conversion rate, total sales, and sessions. For a deeper dive, you can head over to the "Analytics" section.
- Amazon Seller Central: Inside Seller Central, go to "Business Reports" and pull up the "Detail Page Sales and Traffic" report. You'll find "Sessions" (your visitors) and "Unit Session Percentage," which is just Amazon's fancy term for conversion rate.
- Walmart Seller Center: Navigate to the "Analytics" section and find the "Performance" dashboard. There, you can view metrics like "Visits" and "Conversion Rate" for your listings over any period you choose.
A report from Google Analytics, for instance, lets you see how user activity and conversions connect in one place.
The real win with a report like this is the ability to tie specific user behaviors directly to sales.
Tracking Micro-Conversions to See the Full Story
If you only focus on sales (macro-conversions), you’re getting an incomplete picture. To really understand the customer journey, you need to track micro-conversions—the smaller actions that signal a shopper is getting serious.
These are valuable steps like:
- Adding an item to the cart
- Signing up for your newsletter
- Creating a customer account
- Watching a product video
Tracking these smaller actions helps you pinpoint exactly where potential buyers are dropping off. If you have a ton of "add to carts" but a low final sales rate, you know the problem isn’t your product—it’s probably your checkout process. This turns your analytics from a simple report card into a powerful diagnostic tool, which is a core idea behind effective data-driven marketing strategies.
Actionable Strategies to Boost Your Conversion Rate
Knowing your conversion rate is one thing, but actually improving it is where the real work begins. Moving from data to action means you need a solid playbook of Conversion Rate Optimization (CRO) tactics. Whether you're selling on a marketplace or running your own D2C brand, the goals are always the same: reduce friction, build trust, and make it ridiculously easy for people to buy.
Think of this as your guide to turning casual browsers into loyal customers. Every strategy here ties directly back to those core principles, giving you a clear path to getting your numbers up.
Optimize Your Product Listings and Pages
If you're a marketplace seller on platforms like Amazon or eBay, your product listing is your storefront. It has to be compelling and trustworthy enough to cut through the noise.
- Write Persuasive Copy: Don’t just list features; sell the benefits. How does your product solve a problem or make someone’s life better? Use bullet points to make the good stuff easy to scan.
- Use High-Quality Images and Videos: Shoppers can’t touch or feel your product online, so your visuals have to do all the heavy lifting. Show your item from every angle, show it in use, and include close-ups of the details that matter. A simple product video can boost conversions by 80% or more.
- Leverage A+ Content: For Amazon sellers, A+ Content is your secret weapon. It lets you use rich images and text to tell your brand's story right on the product page. This is your chance to build a real connection and answer questions before a shopper even thinks to ask them.
These same rules apply to D2C brands, too. Your product page needs to create an experience that’s both informative and engaging enough to guide visitors straight to that "Add to Cart" button.
Streamline the Checkout Process
Cart abandonment is the arch-nemesis of a healthy conversion rate. A clunky, confusing, or sketchy-looking checkout is usually the biggest leak in any sales funnel. Your job is to make giving you money as painless as possible.
Time and time again, studies show that unexpected costs are the #1 reason people abandon their carts. Be upfront about shipping fees, taxes, and any other charges early on. A surprise at the final step is a guaranteed conversion killer.
Here are a few quick wins:
- Offer a Guest Checkout Option: Forcing someone to create an account before they can buy adds a massive amount of friction. In fact, 24% of shoppers will ditch their cart if they have to create an account.
- Simplify Your Forms: Only ask for what you absolutely need to process the order. Use auto-fill features and clear labels to make it fast and easy.
- Provide Multiple Payment Options: Don't miss a sale because you don't offer the right payment method. Include trusted gateways like PayPal, Apple Pay, and Google Pay alongside the usual credit card options.
By clearing these common hurdles, you make it easy for customers to finish what they started. If you're on a specific platform, you can find guides with more tailored advice, like these effective strategies to boost your Shopify conversion rate.
Build Unshakeable Trust and Confidence
People will not buy from a website they don’t trust. Period. Building that confidence isn't just a nice-to-have; it's a non-negotiable part of improving your conversion rate. Every single element on your site should be working to reassure visitors that their purchase is safe and their decision is a good one.
Trust is the currency of ecommerce. Without it, even the best product at the best price will struggle to convert. You build it with transparency, social proof, and a clear commitment to security.
Sprinkle these trust signals throughout your site, especially on product pages and during the checkout flow:
- Display Social Proof: Customer reviews, testimonials, and user-generated photos are pure gold. Nearly 95% of shoppers read online reviews before pulling the trigger on a purchase.
- Showcase Security Badges: Display SSL certificates and the logos of trusted payment providers. These small icons go a long way in reassuring customers that their financial info is locked down.
- Improve Site Speed: A slow, laggy website just feels unprofessional and untrustworthy. A one-second delay in page load time can slash conversions by 7%.
Putting these strategies into practice is an ongoing process of testing and tweaking. For a deeper dive with even more ideas, check out our full guide to conversion rate optimization tips.
Frequently Asked Questions About Conversion Rates
Navigating the world of conversion rates always brings up a few common questions. Getting clear, straightforward answers is the key to applying these concepts with confidence and making smarter calls for your ecommerce business.
How Often Should I Check My Ecommerce Conversion Rate?
For most online stores, checking your conversion rates weekly or bi-weekly is the sweet spot. This rhythm helps you spot meaningful trends without getting whiplashed by the daily noise from random sales spikes or holiday traffic.
Save the monthly and quarterly reviews for bigger-picture thinking. These check-ins are perfect for measuring the real impact of major changes, like a website redesign or a new marketing campaign. Just try to avoid checking daily—it's a surefire way to make reactive decisions based on data that hasn't had time to tell the whole story.
What Is The Difference Between Conversion Rate and Click-Through Rate?
Click-through rate (CTR) and conversion rate are often confused, but they measure two totally different stages of the customer's journey.
- Click-Through Rate (CTR) tells you what percentage of people clicked your ad or link after seeing it (clicks ÷ impressions). It’s all about how good your ad creative or product title is at grabbing attention and getting someone interested.
- Conversion Rate measures the percentage of visitors who actually followed through with an action (like a purchase) after landing on your site (conversions ÷ visitors).
Think of it like this: CTR gets people to your front door, while your conversion rate tells you if they bought something once they were inside. You can't have a good conversion rate without a solid CTR bringing qualified traffic in the first place.
Can A High Add To Cart Rate With A Low Conversion Rate Still Be A Good Sign?
Absolutely. In fact, it’s an incredibly valuable clue. A high "add to cart" rate is a great sign that your product pages, pricing, and marketing are hitting the mark. People are clearly interested in what you're selling.
When the final conversion rate is low, it shines a spotlight directly on friction in your checkout process. This data tells you exactly where to focus your energy: the cart and checkout funnel. The usual suspects? Unexpected shipping costs, a clunky registration process, or not enough trusted payment options.
Ready to turn more clicks into customers? Next Point Digital combines data-driven strategy and marketplace expertise to scale your sales on Amazon, Walmart, and your D2C store. Start growing your business today.